
Identify and interpret oceanic and water features and systems
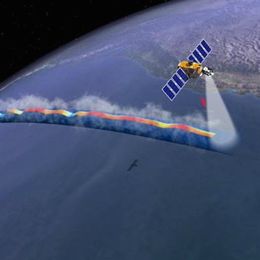
This case study demonstrates the usability of wave height altimetry data from Jason-2.
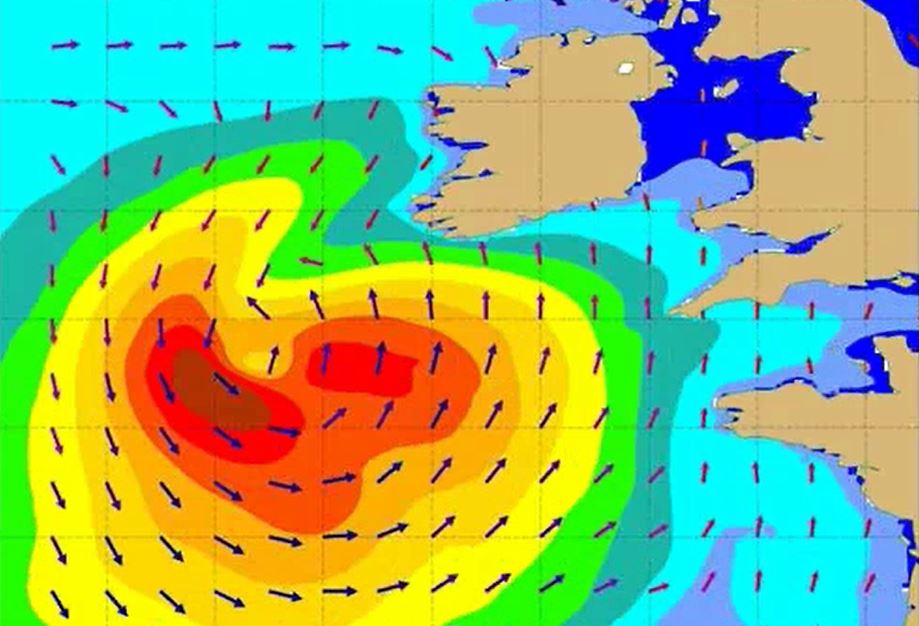
This case study treats a storm over the Atlantic which started its development on 14 April 2012 and lasted until 17 April. The deepening depression and associated strong surface winds gave birth to high waves and sea swell affecting the northern Spanish coasts. The case study focuses on sea level altimetry data provided by Jason-2. A comparison with ECMWF wave model (WAM) is undertaken.
The aim of the case study is to show the quality of Jason-2 data in comparison with model data and in situ measurements.
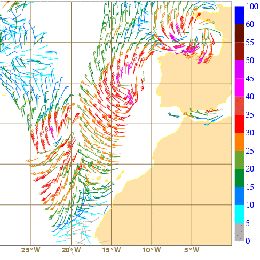
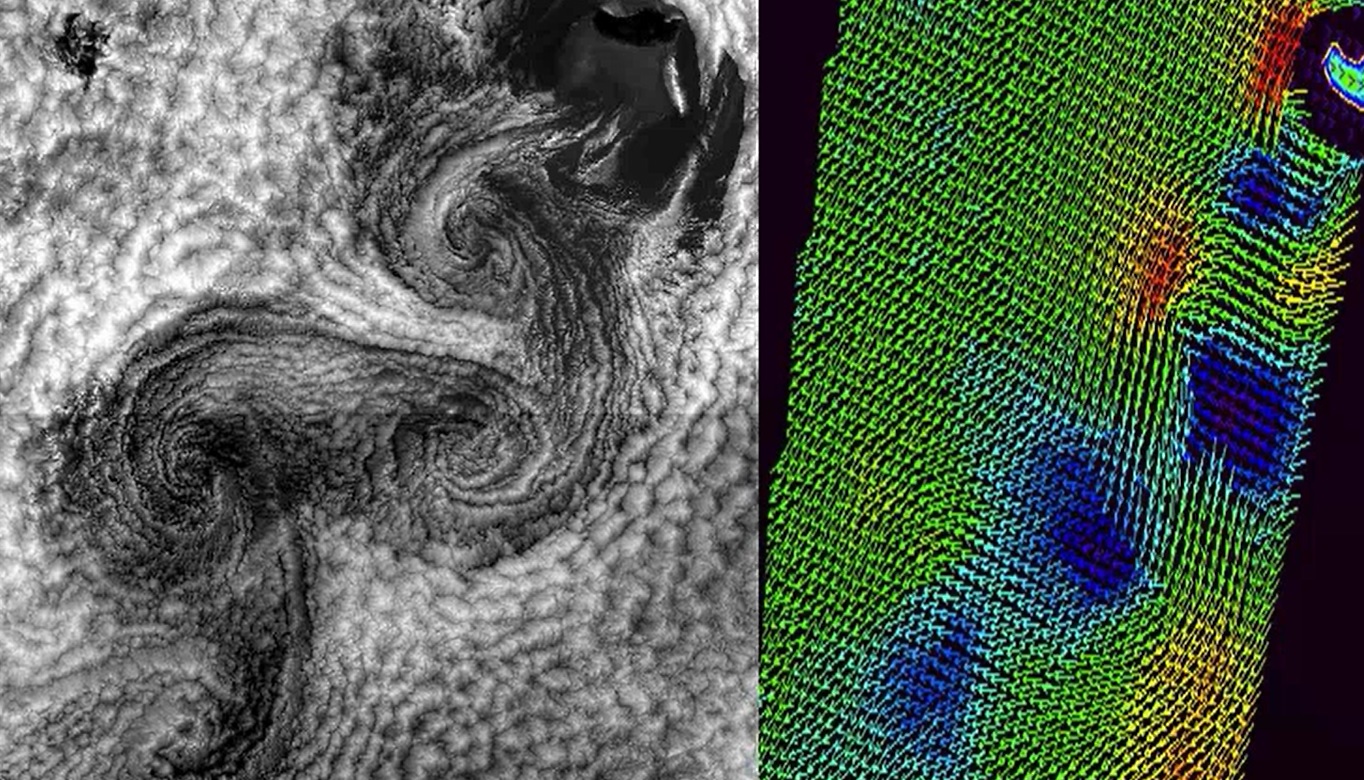
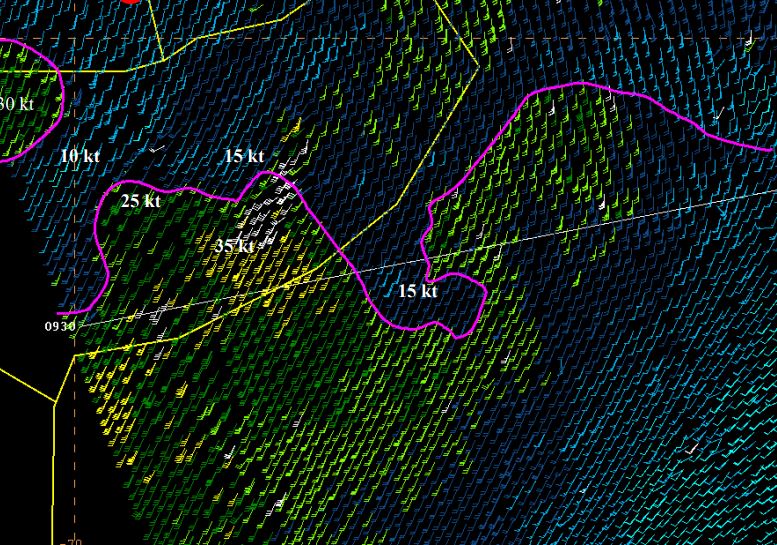
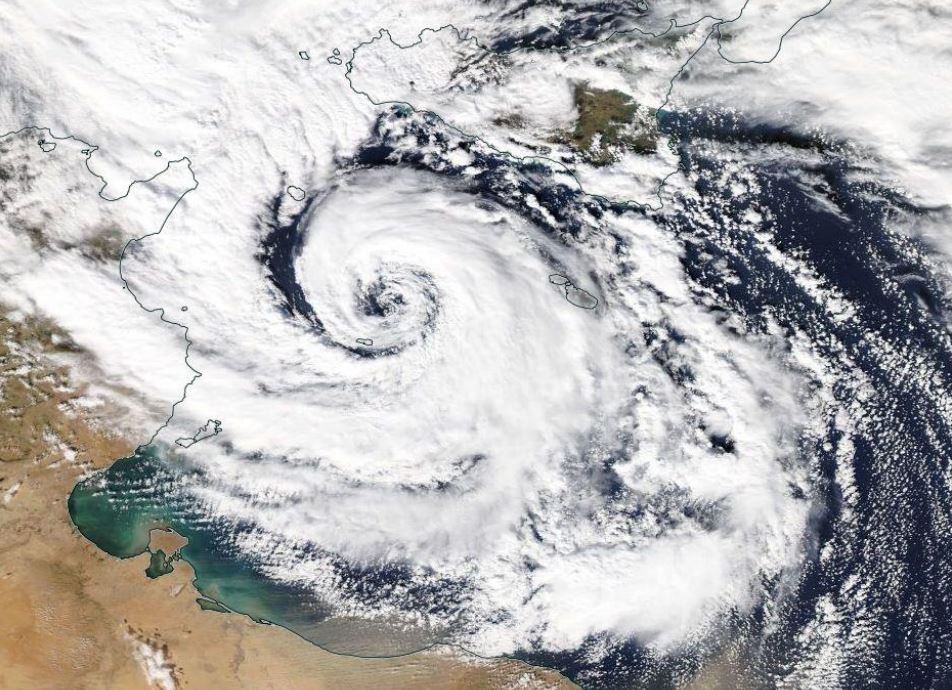
Storm Xynthia developed over the North Atlantic in late February 2010. The ASCAT sensor of EUMETSAT MetOp-A satellite tracked its evolution and provided insight into the life cycle of the storm.
This case study covers the development of storm Xynthia. Xynthia evolved out of a low pressure system which formed east of the Bermuda and lasted for 8 days. The storm was well depicted in satellite imagery and showed strong convective activity over the Atlantic. When approaching Western Europe and crossing Northern Europe, Xynthia was mainly a windstorm with gusts exceeding 150 km/h. The module briefly describes the functional principle of the ASCAT sensor and illustrates how measurement is performed and wind speed is retrieved. A comparison of ASCAT winds with NWP and surface winds is given, showing the benefits and drawbacks of each data source. Chapter 2 of the case study investigates the storms life cycle. In combination with satellite images, ASCAT wind data are plotted revealing deeper insight into the wind circulation close to ocean surface. The detailed analysis of the wind fields shows additional information on the position of the surface fronts and the location of pressure minima. Ongoing measurements of wind speed and direction from ASCAT is compared with NWP data and surface observations. The life cycle of storm Xynthia, from its real beginning over the Atlantic until its filling over the North Sea, is followed. During this time, Xynthia was covered 8 times by overpasses of the ASCAT sensor.
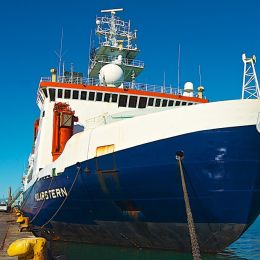
In this Training Module you can follow the voyage of the research vessel Polarstern across the Atlantic and observe various atmospheric phenomena.
Follow the voyages of the research vessel Polarstern through different climate zones and weather situations in three oceans - Arctic, Atlantic and Antarctic. Learn more about fog, winds and convection, the globel circulation and climate zones. See how satellite images help you observe the atmospheric phenomena.
In this Training Module you will learn more about how the sea surface temperature is measured from satellite instruments.
Sea surface temperatures have been measured for over one hundred years, first using in situ instruments, which provide limited spatial and temporal coverage, and since the 70's from satellite. Depending on the satellite operating wavelength range, the temperature estimations correspond to distinct ocean depths. This tutorial is focused in the temperature of the surface emitting layer of ~ 10-20 μm depth, estimated from infrared measurements, the so-called Skin Sea Surface Temperature (SST). There are several SST providers and the choice of the most suitable product depends on the user application. In this tutorial several examples of SST datasets are shown, as well as some applications of this product.
The lecture dels with the characteristics of satellites carrying instruments for measuring winds and with the logic behind the calculations of winds using satellites.
Length: 51 min
Author: Ad Stoffelen (KNMI)
The lecture deals with modelled winds and winds derived from instruments onboard satellites like Metop-A and Metop-B in low orbits around the Earth (polar orbits). Today's models are evolving at a rate that is faster than the increase of density of observations and that presents a problem for forecasts. Here stands the question 'Will meteorology continue to develop and improve?'. The lack of observed data is thus filled with the data from satellites, although this data also has its own constraints due to the way it is derived. In the lecture the characteristics of the satellites carrying instruments for measuring winds and waves will be explained and the logic behind the calculations of winds using satellites will be discussed.
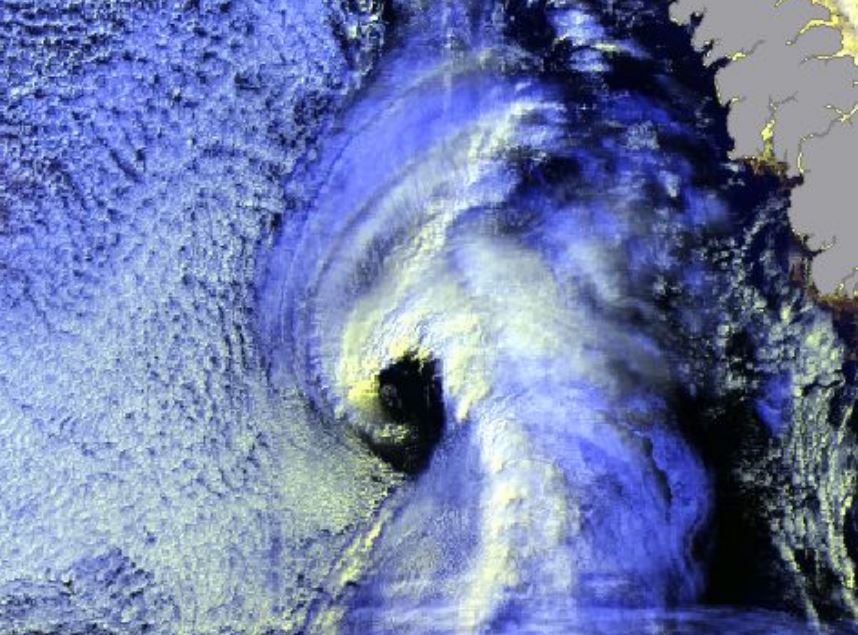
Gunnar Noer presents facts on Polar Lows, how they are forecasted, and gives examples of interpretation of satellite imagery.
Length: 55 min
Author: Gunnar Noer (MetNo)
Polar Lows can be seen as small Arctic hurricanes, and they have a severe impact on shipping and coastal communities in Scandinavia. They are most common in the Barents Sea and the Norwegian Sea, but are also known to occur in the central North Sea and surrounding coastal areas. Polar lows are the most intense type of wintery convection weather phenomenon in this area. Thus, a familiarity with Polar Lows will also increase our ability to forecast the more common snow shower events in the winter season. This talk will present some facts on Polar Lows, how they are forecasted, and give examples of interpretation of satellite imagery.
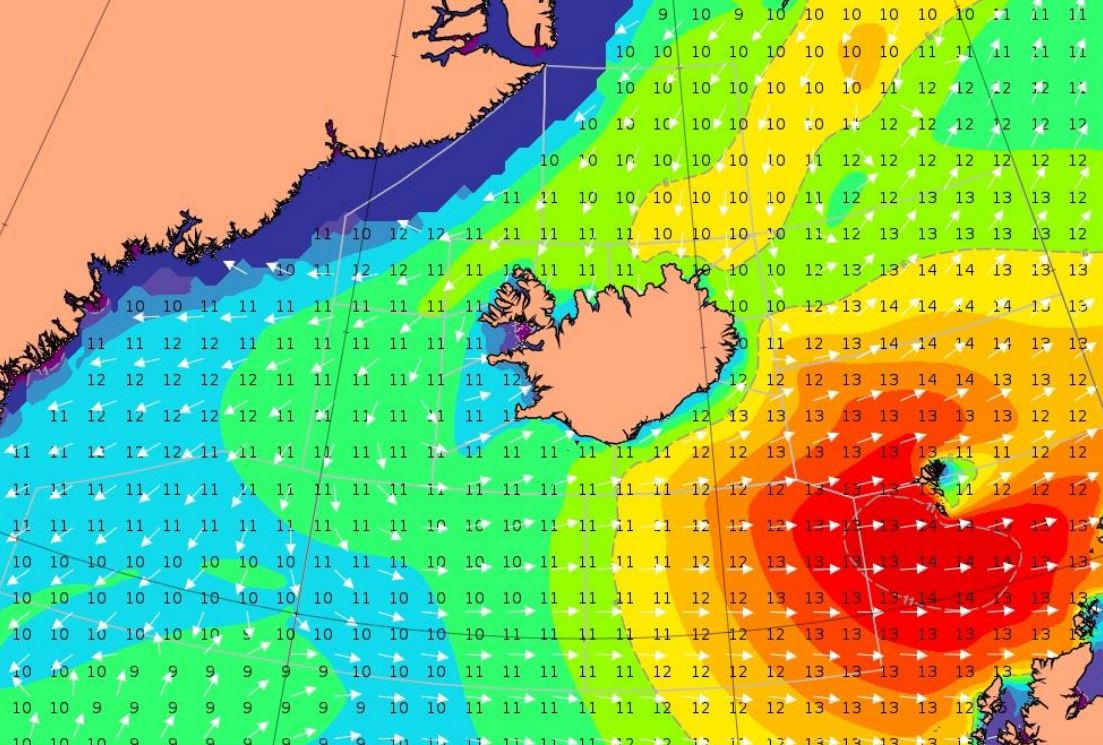
Björn Einarsson analyzes a storm moving south-east of Iceland.
Length: 30 min
Author: Björn Einarsson
Case 1. Between April 2. and April 4. 2018, gale to storm force winds from the west propagated from Cape Farewell, the southernmost point of Greenland over 1000 nautical miles across the Atlantic towards and past the Faroes Islands with high waves. This type of eastward wind/wave field propagation south of Iceland happens few times a year with varying intensity. Case 2. A showcase of the westerly Greenland tip jet creating large waves – but looking at the forecasted winds and waves versus observations, they seem contradictory, making the forecaster think twice.
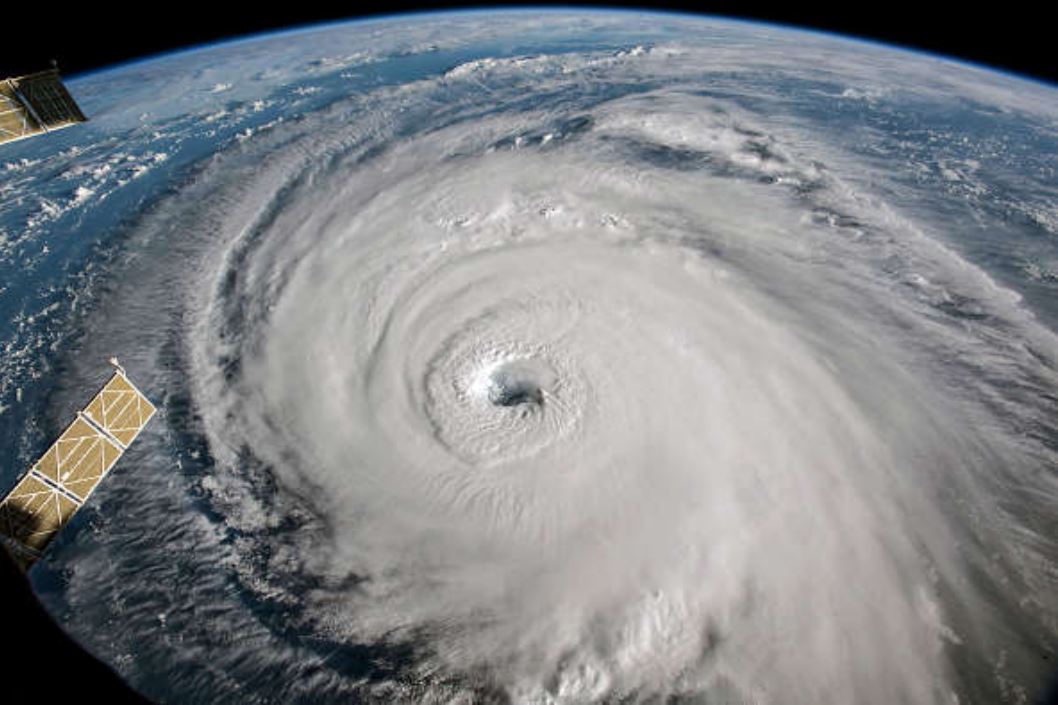
Carlos Ramalho presents some tropical and extra-tropical cyclones that affected the Azores and the challenges forecasters face in this situations.
Length: 30 min
Author: Carlos Ramalho (IPMA)
Due to the Azores geographical location, this archipelago is occasionally affected by strong Extratropical cyclones and Tropical cyclones. Extratropical cyclones are more frequent in winter and are often associated with strong winds, heavy precipitation and heavy waves which can be damaging and contribute to social and economic distress. Tropical cyclones, on the other hand occur mostly in September and October and in the past have caused loss of lives and property damage. Forecasting this type of systems is very challenging, mostly because a small variation in path can cause large difference in the impacts. This talk presents some tropical and extratropical cyclones that affected the Azores and also the challenges that forecasters face in this situations.
Joseph Sienkiewicz discusses forecasting challenges for large ocean areas along with the application of satellite winds and waves.
Length: 60 min
Author: Joseph Sienkiewicz (NOAA)
The NOAA Ocean Prediction Center (OPC) is responsible for weather warnings and forecasts for the western North Atlantic and eastern and central North Pacific Oceans. The oceans remain relatively data sparse for observed conditions. To compensate, OPC has successfully used winds from scatterometers and wave heights from altimeters to better understand and predict hazardous conditions over the waters of responsibility. Weather forecasting challenges for large ocean areas will be discussed along with the application of satellite winds and waves.
Ioannis Pytharoulis shows past cases of Medicanes, the description of their structure and characteristics.
Length: 50 min
Author: Ioannis Pytharoulis (Aristotle University of Thessaloniki)
The Mediterranean tropical-like cyclones are intense sub-synoptic maritime lows with strong winds, axisymmetric warm-core structure and tropical cyclone features, such as a cloud-free eye and spiral deep convection. They are frequently referred to as medicanes (MEDIterranean hurriCANES) due to their resemblance to tropical cyclones. Despite their low frequency (of about 1.1-1.6 systems per year), medicanes constitute a serious natural hazard to life, property and the environment of the coastal regions of the Mediterranean basin and the Black Sea. Their accurate prediction is a challenge for the numerical weather prediction models. This presentation includes some past cases of medicanes, the description of their structure and characteristics, criteria that are used to define them, the development mechanisms, climatology, consequences and finally a detailed case study of medicane Qendresa (November 2014).
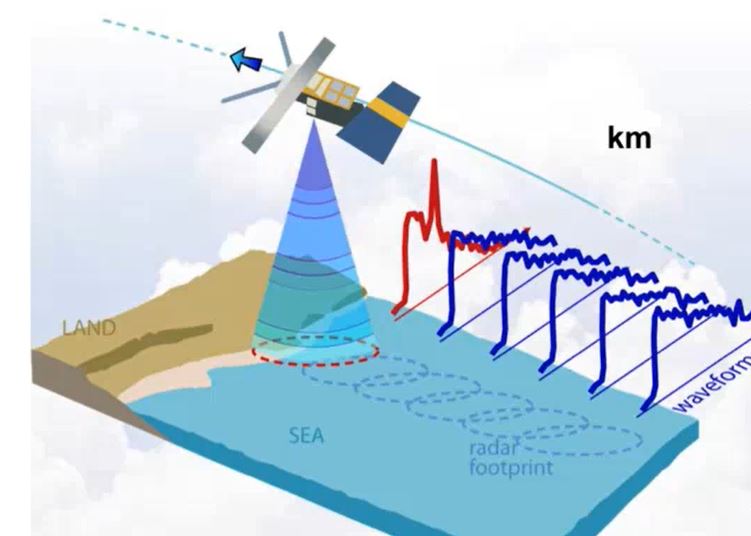
Zorana Jelenak describes how altimeters work, how data is used for everyday marine forecasting at NOAA and assimilation.
Length: 60 min
Author: Zorana Jelenak (NOAA)
Altimeter data have been used to produce maps of sea surface height, geostrophic velocity, significant wave height and wind speed. This information is of proven use to mariners as well as to the scientific community. Uses of the data include commercial and recreational vessel routing, ocean acoustics, input to geographic information systems developed for the fishing industry, identification of marine mammal habitats, fisheries management and monitoring ocean debris. Such information is accessible in near-real time (within 3 to 48 hours) and to improve weather forecasting models by assimilation. 25 years of data makes it possible to study the whole ocean or regional areas for offshore industries or navigation. In hurricane studies altimetry measures very high waves and strong winds, but also helps identify sea surface height anomalies which can be used as proxies of the warm currents - hurricanes energy source. The lecture will describe how altimeters work, how data is used for everyday marine forecasting at NOAA and assimilation, devoteting special attention to data accuracy and limitations.
Jean Bidlot gives an overview on the ECMWF wave model products.
Length: 50 min
Author: Jean Bidlot (ECMWF)
Wave models are able to give a very detailed description of the conditions at the surface of the oceans. The mean sea state is fully described by the 2d wave spectrum. This detailed description is however not always very practical and the bulk of the information contained in the 2d spectrum is usually reduced in the form of a set of integrated parameters, from a simple few such as significant wave height, mean wave direction and mean wave period, to more sophisticated parameters that described distinct part of the wave fields. Recent advances in the understanding of wave dynamics have lead to the development of new set of parameters that give information on the possible largest single wave that might exist over a certain area within a certain time frame. It is now possible to describe the sea state with different level of complexity depending on the user needs.