
Marine forecasting
Listed here are other resources related to Marine forecasting tag:
Note: click on an image to open the Resource
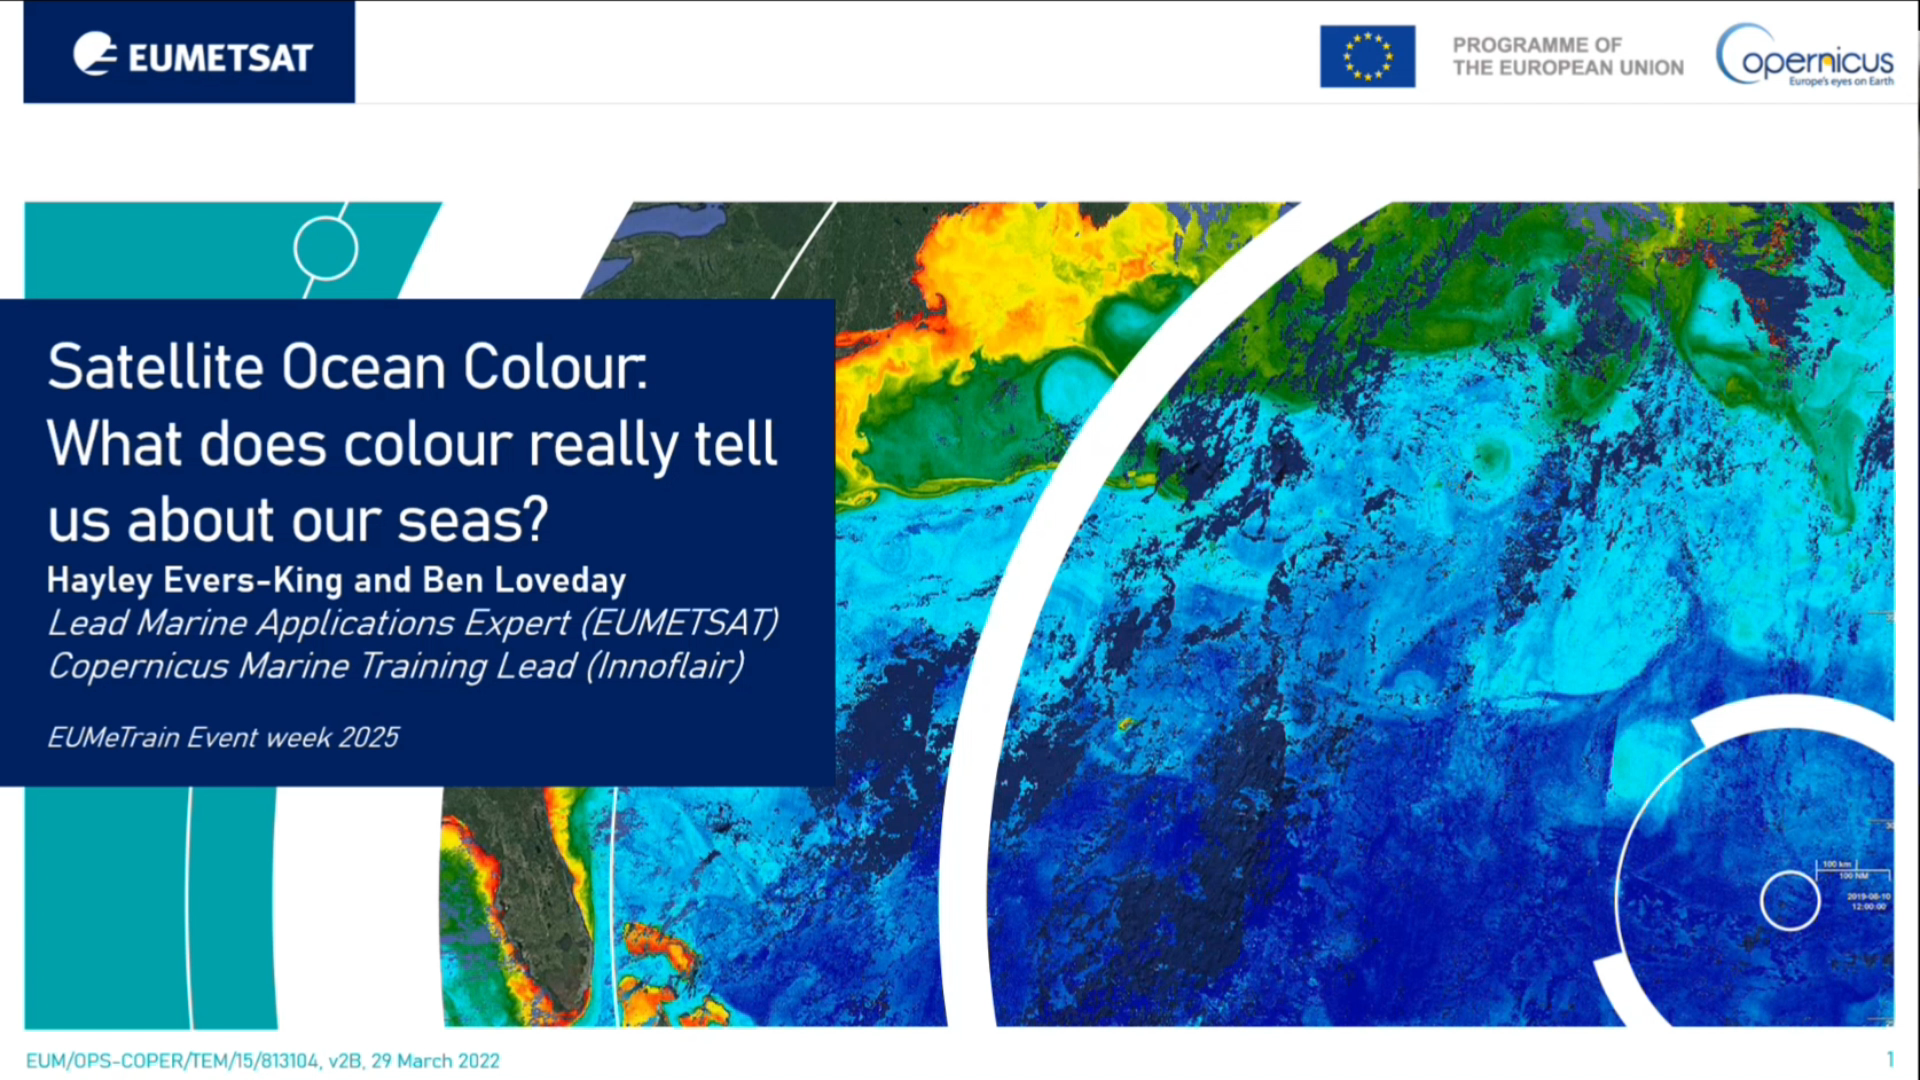
Hayley Evers King shows how to interpret ocean colour and talks about different information we can obtain from satellite derived measurements.
Satellite-based measurements of ocean colour quantify the visible light reflected from the ocean surface. These data represent the interactions between light from the sun and the various constituents that can be present in our ocean waters. As such, this signal can be 'decoded' by a range of techniques to provide information on these constituents. This presents an evolving array of societally relevant applications, from fisheries and aquaculture management, to water quality warnings, and climate reporting. This presentation will cover some fundamentals of ocean colour theory, current missions and products, and examples of this data in use.
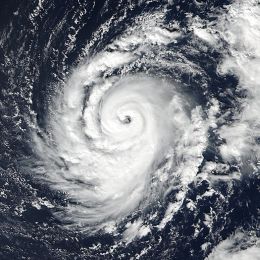
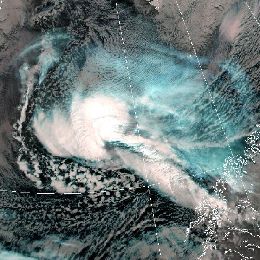
This case study describes the evolution and the life cycle of hurricanes in general and the evolution of hurricane Ophelia (2017) in particular.
This module and the adjoined simulator treat the hurricane Ophelia that threatened Europe in 2017 and hit the coast of Ireland in October that year.
In this module, you will learn more about hurricanes in general and about the evolution of Ophelia in particular from the very beginning over the Atlantic until its final stage over Ireland.
In the adjoined simulator, you will forecast the warnings related to hurricane Ophelia and the dangers that arose with this weather situation.
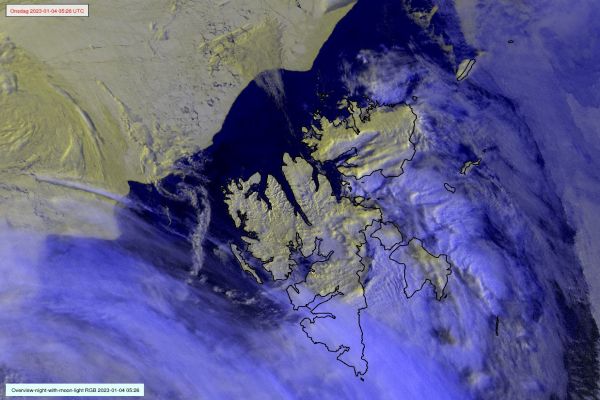
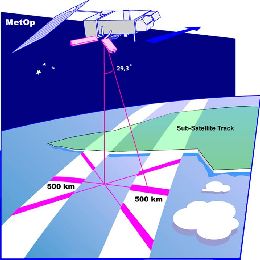
Signe Aaboe presents the data and software that OSI SAF offers to users.
Ocean and Sea Ice Satellite Application Facility (OSI SAF) was initialised in 1997 and is one of eight EUMETSAT Satellite Application Facilities, which provide users with operational data and software products from meteorological satellites.
The OSI SAF programme has a focus on the ocean-atmosphere interface and derives ocean products of wind, temperature, radiative fluxes and several perspectives of the sea ice. This presentation will give an introduction to OSI SAF, - what it is, who is involved, and which products are derived. The main focus will be on sea-ice developments and products.
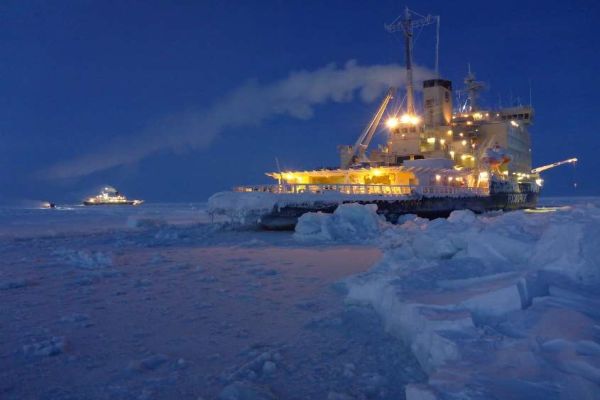
Robert Hausen describes his journey in the Arctic during the MOSAIC project.
The presentation is about the Multidisciplinary drifting Observatory for the Study of Arctic Climate (MOSAiC) from a forecaster’s perspective. As kind of an experience report this talk gives some impressions from the preparation before the expedition started up to the uncertain outcome of Leg 3 of 6 due to the Corona Crisis and other circumstances.
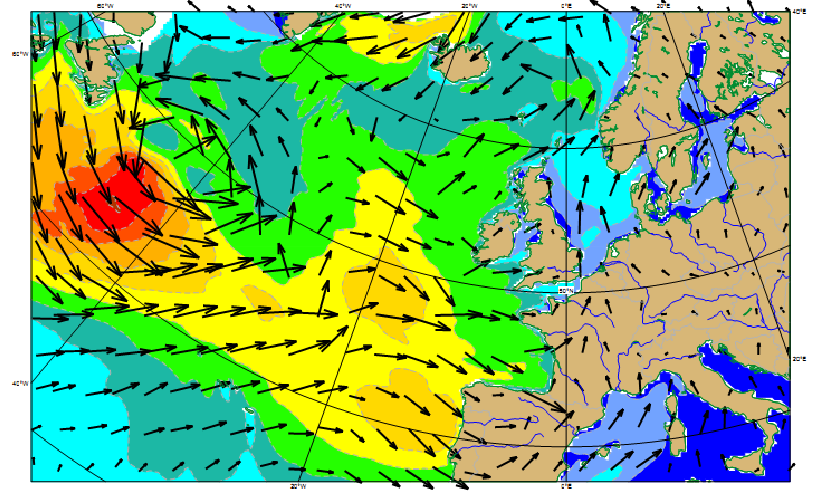
Ad Stoffelen gives a presentation on scatterometer winds, backscattering theory and current scatterometer instruments.
Winds over sea are essential for marine forecasting and used in nowcasting and numerical weather prediction (NWP) to aid, among others, in off-shore activities (e.g., energy sector), transport and recreation, particularly to secure safety of life and property. Winds over sea are observed by satellites and available from NWP model forecasts. Most satellite winds over sea are provided by scatterometers these days; they provide swath fields of both wind speed and wind direction from polar satellites. More satellite winds are becoming available through a global virtual constellation of scatterometers. Currently, winds from MetOp-A, MetOp-B and the Indian OceanSat-2 are operationally available and provide good day coverage. Moreover, winds from the Chinese HY2A satellite are being tested with good results at KNMI and further scatterometer launches are being approved. The lecture will briefly comment on these developments, but mainly focuses on what scatterometer winds really represent, how good they are for marine forecasting and what aspects need attention when applying these winds in your routine operations.
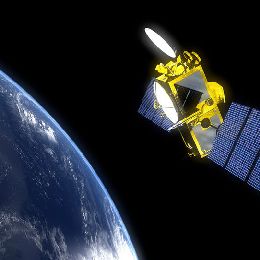
Joseph Sienkiewicz gives a presentation on satellite altimeters. He compares the satellite altimeter data from different sensors with NWP forecast data.
Conventional observations of wind and wave data from ships and buoys are limited by coverage. Due to the increasing size of ships, observers are more removed from the ocean surface and wave estimation is more difficult. Satellite altimeters are a downward pointing radar that scan the oceans and provide very accurate observations of wave height, wind speed, sea surface height anomaly. Our understanding of sea level-rise is due in large part to the record of altimeter based sea level data.
Forecasters responsible for ocean and coastal waters must rely on any information for situational awareness and to keep forecasts relevant. Satellite altimeters provide very accurate coincident measures of significant wave height and wind speed. Integrated data display and product generation systems offer the opportunity for forecasters to compare a variety of observations, imagery, and numerical model predictions to enhance awareness and communicate hazards to mariners. This session will discuss the use by forecasters of altimeter wave and wind data with other sources in an operational forecast center.
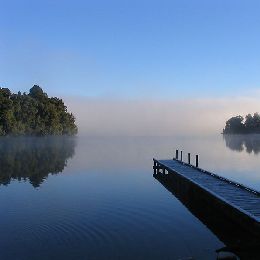
Ismail Gultepe gives a presentation on marine fog formation, development, and dissipation. He focusses on surface instruments and remote sensing platforms, as well as on its forecasting based on numerical models.
Marine fog formation, development, and dissipation depend on many important physical, chemical, radiative, dynamical, and thermodynamical processes as well surface characteristics of the location in the ocean-land boundary system. Marine fog can be either warm fog or cold fog depend on temperature (T); if T is less than or equal to zero in the air, fog is called as freezing fog. The main reason of the fog formation is usually due to warm and moisture air advection over the cold ocean surface or over the radiatively cooled land surface. Ts-Td (ocean surface T and air dew point T) difference of about 2°C is usually used for a limit for fog formation. It is also possible that local marine environment can enhance or weaken the fog intensity because of vegetation, surface height, and sea breezes. Fog over the marine environments is usually dissipates at noon because of radiative heating and mixing due to turbulence with higher dry air. The intensity of fog is the function of liquid water content (LWC) and droplet number concentration (Nd) of the particles in the air mass. Increasing LWC and Nd result in visibility down to 10s of meters. In this presentation, marine fog observations using surface instruments and remote sensing platforms, and as well as its forecasting based on numerical models will be discussed and its effect on aviation, marine environment, transportation, and vegetation will be summarized.
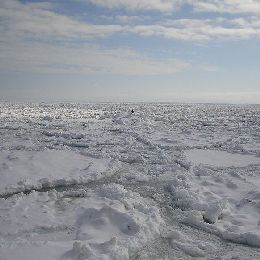
Juha Karvonen gives a presentation on accurate measurement of sea ice properties. His presentation covers the remote sensing techniques for detecting and measuring sea ice.
Accurate measurement of sea ice properties is important for example in initializing numerical weather and ice models (data assimilation), navigation in the sea ice covered areas, and for monitoring the annual changes in the global ice cover (climate change). The presentation will cover the remote sensing (RS) techniques for detecting and measuring sea ice. Measuring of different sea ice parameters based on space-borne Rs instruments has been developed significantly during the recent years, and many sea ice parameters can now be measured by different RS instruments. The sea ice parameters that can be measured by RS include ice type, ice deformation, ice concentration (ice area), ice thickness and ice drift. Different kind of RS instruments are used for measuring these quantities: radiometers operating at different wavelengths, sunthetic aperture radars, coastal radars, altimeters. The presentation covers these methods and an introduction to algorithms for measuring the ice parameters. Existing ice products are presented, and also the deficiencies of the methods and validation of the measurements are shortly discussed.
Jean Bidlot gives a presentation on numerical methods and models which accurately describe the ocean waves and swell.
Nowadays, an accurate description of the surface waves that are generated by the wind (wind waves) can be achieved by running a wave model. In turn, waves affect the wind profile over the oceans. Such an effect is accounted for in the ECMWF forecasting systems by having a wave model component within the atmospheric model.
A brief review of the essence of how ocean waves forecasts are obtained will be presented. This will be followed by a comprehensive description of the type of wave products that are available (from deterministic to probabilistic one). Waves are essentially global and can therefore affect areas far away from the generating storms. Examples will be presented to illustrate these last points.
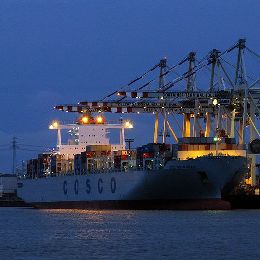
Thomas Bruns gives a presentation on route and time optimisation of oversea transports. He discusses the climate and weather influences on ship tracks.
Thomas Bruns gives a presentation on the history of ship routing and its improvements in the last 20 years, further on ocean waves and its related hazards. He gives an introduction to the classical methods of navigation. Route optimization is closely related to the ship performance, time optimization will not work without the knowledge of detailed ship properties. Finally, the two competing ways of navigating ships across the ocean, namely onboard and shore-based routing, will be discussed.
Gunnar Noer gives a detailed presentation on the formation of Polar Lows, the climatology and forecasting methods.
Polar lows are small but fairly intense lows that develop during cold air episodes during the winter season in the marine Arctic. The lecture will address some of the basic formation processes, the climatology and traditional forecasting based on deterministic short range models. Recently, Polar Lows are tracked using fine scale EPS based on the UM, and presently the Harmonie 2,5 km model. Results are represented as an estimate of probability for PL tracks, wind and precipitation.
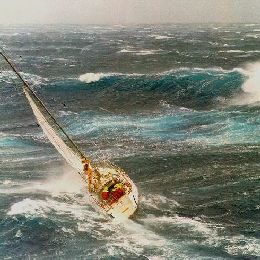
Jean Bidlot presents probabilistic forecasting based on ensemble technique to ascertain the probability of extreme weather, including wave parameters.
Length: 45 minutes.
For any operation at sea or in the coastal area, forecasts of the sea state are essential. The quality of those forecasts has steadily improved over the years as attested by the successful forecasts of the many large waves events that affected the Euro-Atlantic coast during last winter. Nevertheless, forecasts of high impact weather can still be uncertain. For this reason, probabilistic forecasting based on ensemble technique should be used to ascertain the probability of extreme weather, including wave parameters, as well as possible alternative scenarios. It is known that freak waves do occur and can result in major damages and losses. Predicting those events is more challenging, nevertheless advances in the theoretical frameworks for those situations have been made and has resulted in new forecasts parameters.