
Identify and interpret oceanic and water features and systems
Gwenaël LE BRAS shows what MTG means in context of SST monitoring.
The MTG-I1 launch introduced the Flexible Combined Imager (FCI), boosting spatial and temporal resolution for Sea Surface Temperature (SST) retrievals. OSI SAF focused first on maintaining service continuity by developing a new Level 3 product matching current MSG resolutions. Higher input resolution from FCI enhances product quality, especially through improved cloud masking. Research is also underway to create a new high-resolution SST product leveraging FCI’s advanced capabilities. The MTG-S1 recent launch will further expand SST coverage, with the processing of the new InfraRed Sounder (IRS) data.
Hayley Evers King shows how to interpret ocean colour and talks about different information we can obtain from satellite derived measurements.
Satellite-based measurements of ocean colour quantify the visible light reflected from the ocean surface. These data represent the interactions between light from the sun and the various constituents that can be present in our ocean waters. As such, this signal can be 'decoded' by a range of techniques to provide information on these constituents. This presents an evolving array of societally relevant applications, from fisheries and aquaculture management, to water quality warnings, and climate reporting. This presentation will cover some fundamentals of ocean colour theory, current missions and products, and examples of this data in use.
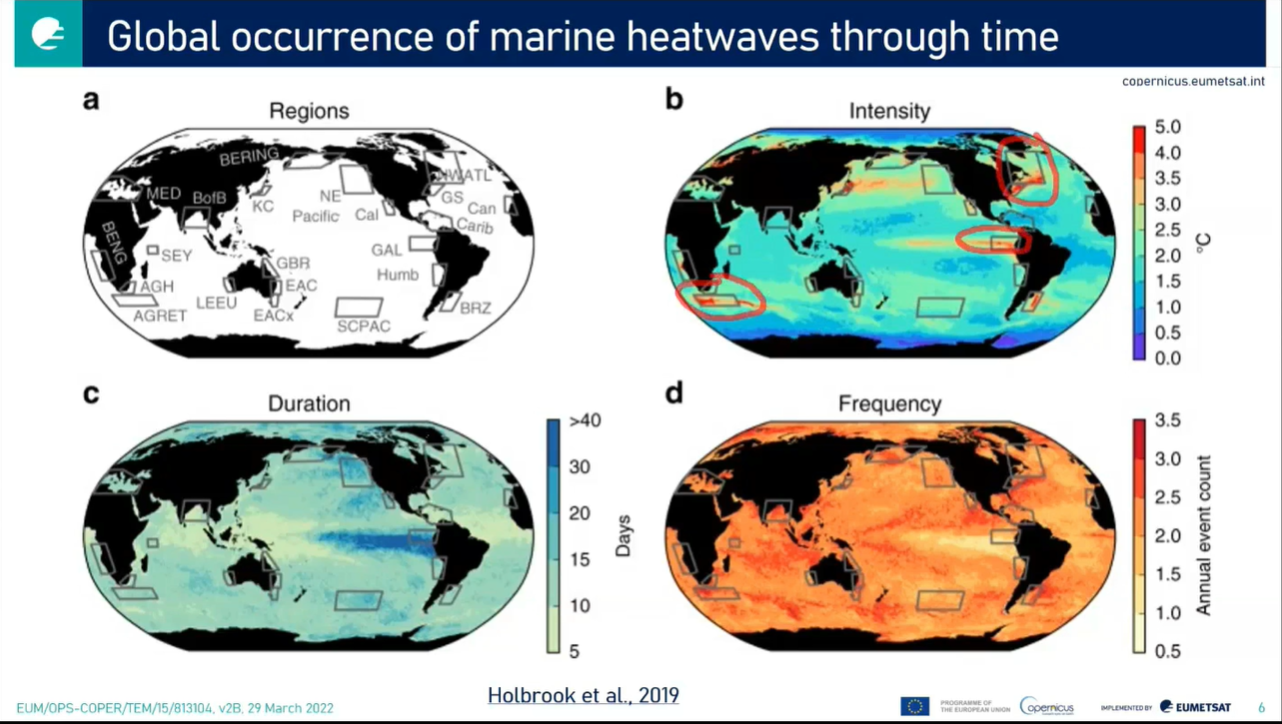
Hayley Evers-King talks about marine heatwaves and using Jupyter Notebooks for satellite data processing and visulization.
Heatwaves don't just happen on land, but also at sea. Periods of extreme regional ocean warming are becoming more frequent and more extreme, affecting our oceans most diverse ecosystems, and those upon which human society depends. In this presentation we'll see how satellite data can be used to identify marine heatwaves, via a practical demonstration in a Python Jupyter Notebook. We'll also consider the connections between heatwaves on land and those that happen at sea.
Vesa Nietosvaara showcases how the MTG's FCI instrument will improve the quality of satellite data, especially for users in high latitudes.
The first Meteosat Third Generation (MTG-I) satellite with Flexible Combined Instrument (FCI) was launched at the end of 2022. It will be followed later in 2024 by MTG-S Satellite with Infrared Sounder onboard. MTG will carry novelty instruments – Infrared Sounder, Lightning Imager and Ultraviolet Visible Near-infrared (UVN) Spectrometer - in the GEO orbit. Meteosat Third Generation aims to secure continuity and to increase the capabilities of the Meteosat satellites in response to requirements of the future forecast/nowcast systems. Altogether, the new and enhanced capabilities will allow us to make a huge step in better monitoring of our environment, and allowing development of new applications.
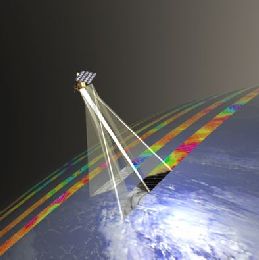
Ad Stoffelen gives a presentation on scatterometer winds, backscattering theory and current scatterometer instruments.
Winds over sea are essential for marine forecasting and used in nowcasting and numerical weather prediction (NWP) to aid, among others, in off-shore activities (e.g., energy sector), transport and recreation, particularly to secure safety of life and property. Winds over sea are observed by satellites and available from NWP model forecasts. Most satellite winds over sea are provided by scatterometers these days; they provide swath fields of both wind speed and wind direction from polar satellites. More satellite winds are becoming available through a global virtual constellation of scatterometers. Currently, winds from MetOp-A, MetOp-B and the Indian OceanSat-2 are operationally available and provide good day coverage. Moreover, winds from the Chinese HY2A satellite are being tested with good results at KNMI and further scatterometer launches are being approved. The lecture will briefly comment on these developments, but mainly focuses on what scatterometer winds really represent, how good they are for marine forecasting and what aspects need attention when applying these winds in your routine operations.
Ismail Gultepe gives a presentation on marine fog formation, development, and dissipation. He focusses on surface instruments and remote sensing platforms, as well as on its forecasting based on numerical models.
Marine fog formation, development, and dissipation depend on many important physical, chemical, radiative, dynamical, and thermodynamical processes as well surface characteristics of the location in the ocean-land boundary system. Marine fog can be either warm fog or cold fog depend on temperature (T); if T is less than or equal to zero in the air, fog is called as freezing fog. The main reason of the fog formation is usually due to warm and moisture air advection over the cold ocean surface or over the radiatively cooled land surface. Ts-Td (ocean surface T and air dew point T) difference of about 2°C is usually used for a limit for fog formation. It is also possible that local marine environment can enhance or weaken the fog intensity because of vegetation, surface height, and sea breezes. Fog over the marine environments is usually dissipates at noon because of radiative heating and mixing due to turbulence with higher dry air. The intensity of fog is the function of liquid water content (LWC) and droplet number concentration (Nd) of the particles in the air mass. Increasing LWC and Nd result in visibility down to 10s of meters. In this presentation, marine fog observations using surface instruments and remote sensing platforms, and as well as its forecasting based on numerical models will be discussed and its effect on aviation, marine environment, transportation, and vegetation will be summarized.
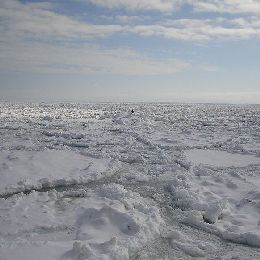
Juha Karvonen gives a presentation on accurate measurement of sea ice properties. His presentation covers the remote sensing techniques for detecting and measuring sea ice.
Accurate measurement of sea ice properties is important for example in initializing numerical weather and ice models (data assimilation), navigation in the sea ice covered areas, and for monitoring the annual changes in the global ice cover (climate change). The presentation will cover the remote sensing (RS) techniques for detecting and measuring sea ice. Measuring of different sea ice parameters based on space-borne Rs instruments has been developed significantly during the recent years, and many sea ice parameters can now be measured by different RS instruments. The sea ice parameters that can be measured by RS include ice type, ice deformation, ice concentration (ice area), ice thickness and ice drift. Different kind of RS instruments are used for measuring these quantities: radiometers operating at different wavelengths, sunthetic aperture radars, coastal radars, altimeters. The presentation covers these methods and an introduction to algorithms for measuring the ice parameters. Existing ice products are presented, and also the deficiencies of the methods and validation of the measurements are shortly discussed.
Jean Bidlot gives a presentation on numerical methods and models which accurately describe the ocean waves and swell.
Nowadays, an accurate description of the surface waves that are generated by the wind (wind waves) can be achieved by running a wave model. In turn, waves affect the wind profile over the oceans. Such an effect is accounted for in the ECMWF forecasting systems by having a wave model component within the atmospheric model.
A brief review of the essence of how ocean waves forecasts are obtained will be presented. This will be followed by a comprehensive description of the type of wave products that are available (from deterministic to probabilistic one). Waves are essentially global and can therefore affect areas far away from the generating storms. Examples will be presented to illustrate these last points.
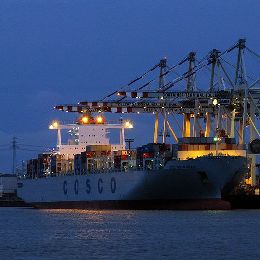
Thomas Bruns gives a presentation on route and time optimisation of oversea transports. He discusses the climate and weather influences on ship tracks.
Thomas Bruns gives a presentation on the history of ship routing and its improvements in the last 20 years, further on ocean waves and its related hazards. He gives an introduction to the classical methods of navigation. Route optimization is closely related to the ship performance, time optimization will not work without the knowledge of detailed ship properties. Finally, the two competing ways of navigating ships across the ocean, namely onboard and shore-based routing, will be discussed.
Jean Bidlot presents probabilistic forecasting based on ensemble technique to ascertain the probability of extreme weather, including wave parameters.
Length: 45 minutes.
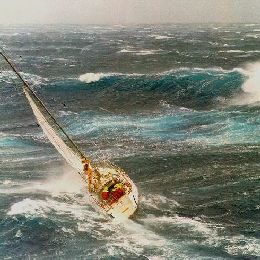
For any operation at sea or in the coastal area, forecasts of the sea state are essential. The quality of those forecasts has steadily improved over the years as attested by the successful forecasts of the many large waves events that affected the Euro-Atlantic coast during last winter. Nevertheless, forecasts of high impact weather can still be uncertain. For this reason, probabilistic forecasting based on ensemble technique should be used to ascertain the probability of extreme weather, including wave parameters, as well as possible alternative scenarios. It is known that freak waves do occur and can result in major damages and losses. Predicting those events is more challenging, nevertheless advances in the theoretical frameworks for those situations have been made and has resulted in new forecasts parameters.
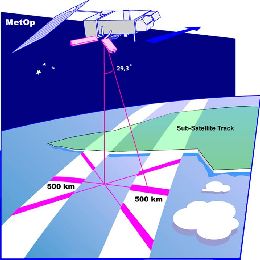
Joseph Sienkiewicz provides an overview of the measuring principles of scatterometers on polar orbiters. The presentation concludes on practical examples showing also attenuation effect by rain droplets.
Ocean surface vector winds derived from polar satellite based scatterometers (radars) allow marine forecasters to view high resolution wind fields over the global ocean. Operational forecasters first access to near real time ocean vector winds began in the early 1990s with the launch of ERS-1 and followed by ERS-2, NASA's NSCAT and QuikSCAT. Of these instruments QuikSCAT, during its ten year life span, provided a wide swath capability allowing forecasters to see entire storms in a single swath. Today, ASCAT on Metop-A, OSCAT on Indian Space Research Organisation (ISRO) OceanSat-2 satellite and in the near future ASCAT-B on Metop-B will continue to provide global coverage. Scatterometer winds provide forecasters a high resolution "sea" truth, give an enhanced situational awareness, the ability to assess the validity of numerical model initial conditions and short term forecasts, and the location and intensity of warning criteria winds. This talk will discuss the above issues by giving examples and also discuss how to interpret remotely sensed ocean winds.
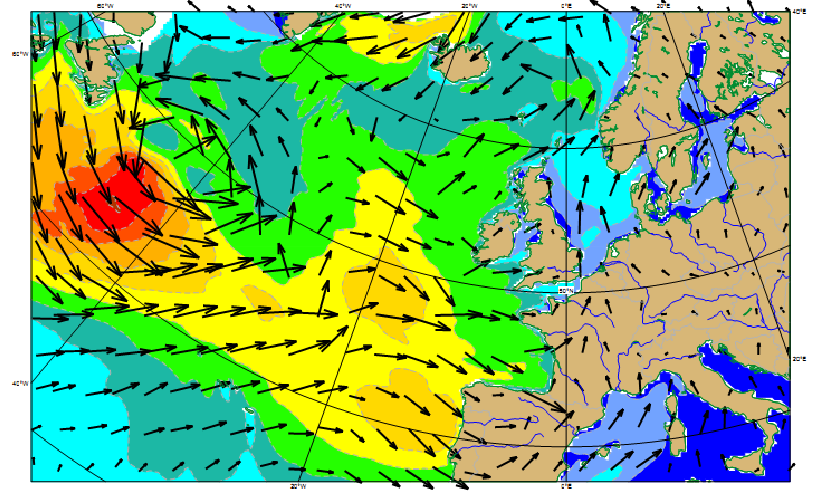
Storm Xynthia developed over the North Atlantic in late February 2010. The ASCAT sensor of EUMETSAT MetOp-A satellite tracked its evolution and provided insight into the life cycle of the storm.
In this presentation Nuno Moreira talks about Xynthia, a storm that affected North Atlantic and Europe in the end of February 2010. He focuses on the cyclogenesis process, which fits the classification of a "bomb", and on the remote observations of the storm. This observation does not only cover MSG imagery, but also ASCAT wind data and derived mean sea level pressure estimates. The advantages and disadvantages of using ASCAT wind in nowcasting for this kind of storms is also discussed.