
Identify and interpret oceanic and water features and systems
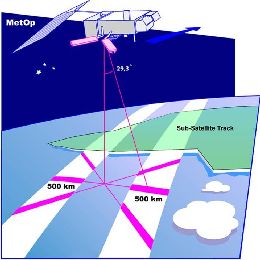
Scatterometer is a main instrument that is gathering information on ocean winds. It is a radar instrument mounted on a satellite.
Another presenter from the OSI SAF, Anton Verhoef (KNMI), did a lecture on Wind products which are closely related to the concept of scatterometry. Scatterometer is a main instrument that is gathering information on ocean winds. It is a radar instrument mounted on a satellite. In this lecture the explanation of principle of scatterometry is given along with explanation of deriving wind fields from scatterometer data. Also there is brief overview of currently available wind products and of tools and methods which are available for visualisation and monitoring of the information. At the end of presentation some words will be given about Quality information and Data formats.
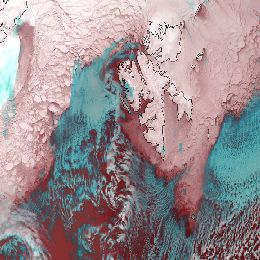
To track and measure sea ice motion and concentration, Passive microwave imagers are used (SSM/I or AMSR-E). These instruments are measuring emitted radiances from below.
Thomas Lavergne from Norwegian Meteorological Institute is presenting the work that has been done within OSI SAF on Sea Ice Applications. General physical role of the sea ice in Earth\'s system we can look through the radiation. In winter time sea is relatively warmer than atmosphere and when sea ice is present it acts like cover to the sea radiation. On the breaking points of ice thus there is suddenly transfer of moisture and heat from the sea to atmosphere, both sensible heat and radiation. This process is responsible for cloud formation and the weather conditions overall. So for (e.g. ship) safety, weather prediction, climate monitoring or ecosystem studies the information on sea ice coverage is crucial. To track and measure sea ice motion and concentration, Passive microwave imagers are used (SSM/I or AMSR-E). These instruments are measuring emitted radiances from below. Thus they don\'t need solar light and can operate both day and night.
Presentation on "Coastal Upwelling and associated phenomena" in which a brief review of the Ekman layers is presented.
Presentation on "Coastal Upwelling and associated phenomena" in which a brief review of the Ekman layers is presented, followed by an overview of several phenomena resulting from wind driven coastal divergence. In addition the presentation of general processes occurring in these areas, several aspects of the summer upwelling off Western Iberia are discussed.
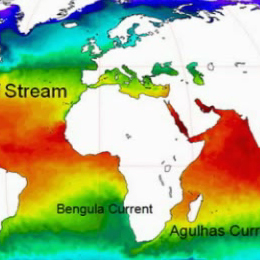
Sea surface temperature (SST), defined as one of the essential climate variables, has a key role in climate research and weather prediction by representing the boundary condition for both the ocean and the atmosphere.
Sea surface temperature (SST), defined as one of the essential climate variables, has a key role in climate research and weather prediction by representing the boundary condition for both the ocean and the atmosphere.
This presentation shows how the SST is retrieved from satellite observations and its main retrieval errors, the instruments and satellites used in its retrieval and the main SST applications. At the end, a brief overview of the future satellite SST-related missions is given.
Scatterometer winds are used by all major NWP centres and by the oceanographic community. At KNMI high resolution ASCAT scatterometer data is assimilated in the NWP High-Resolution Limited Area Model (HiRLAM).
Over the last years the processing of ERS scatterometer winds has been refined. Subsequently, High Resolution Limited Area Model, HIRLAM, and ECMWF model data assimilation experiments have been carried out to assess the impact of one scatterometer, ERS-1 and of two scatterometers, ERS-1 and ERS-2, on the analyses and forecasts. We found that scatterometer winds have a clear and beneficial impact in the data assimilation cycle and on the forecasts. Furthermore, ECMWF has shown that ERS scatterometer data improve the prediction of tropical cyclones in 4Dvar, where unprecedented skillful medium-range forecasts result of potential large social-economic value. Nevertheless, scatterometer winds contain much sub-synoptic scale information where the smallest scales resolved are difficult to assimilate into a Numerical Weather Prediction, NWP, model. This is mainly due to the otherwise general sparsity of the observing system over the ocean. In line with this it is found that scatterometer data coverage is very important for obtaining a large impact. In that respect future scatterometer systems such as SeaWinds on QuikSCAT and ADEOSII, and ASCAT on EPS are promising.
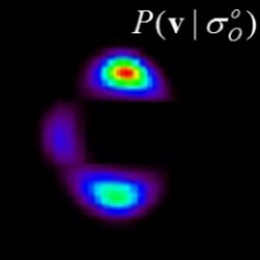
Satellite based scatterometers provide high resolution all-weather wind vector fields over the seas. Wind speed and wind direction are provided at high accuracy under all weather conditions.
Scatterometers uniquely define the mesoscale wind vector field at the sea surface by measuring the radar backscatter signal from wind-generated cm-sized, so-called gravity-capillary sea waves. Because of the wavelength (5 cm), the signal of ASCAT is not affected by rain, and is therefore an "all-weather" system.
The all-weather capability of the ASCAT scatterometer provides unique wind field products of the most intense and often cloud-covered wind phenomena, such as polar front disturbances and tropical cyclones. As such, it has been demonstrated that scatterometer winds are extremely useful in the prediction of extra-tropical and tropical cyclone). Moreover, high-resolution near-surface winds as provided by scatterometers are very relevant because these winds drive the ocean water circulation, which in turn plays a major role in the climate system and in marine life and its exploitation (e.g., fishery).
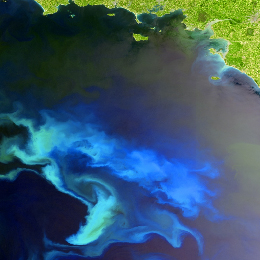
Presentation about satellite images of phytoplankton chlorophyll in the North Atlantic.
Presentation about satellite images of phytoplankton chlorophyll in the North Atlantic. André Valente introduces how phytoplankton chlorophyll is measured from space, describing the spatial and temporal patterns observed in the satellite images and identify the physical processes responsible for the observed variability.
The most important light-absorbing substance in the oceans is chlorophyll, which phytoplankton use to produce carbon by photosynthesis. Due to this green pigment - chlorophyll - phytoplankton preferentially absorb the red and blue portions of the light spectrum (for photosynthesis) and reflect green light. So, the ocean over regions with high concentrations of phytoplankton will appear as certain shades, from blue-green to green, depending upon the type and density of the phytoplankton population there. The basic principle behind the remote sensing of ocean color from space is this: the more phytoplankton in the water, the greener it is....the less phytoplankton, the bluer it is.
Webcast on the study of ocean color which helps scientists to gain a better understanding of phytoplankton and their impact on the Earth system.
Webcast on the study of ocean color which helps scientists to gain a better understanding of phytoplankton and their impact on the Earth system.
These small organisms can affect a system on a very large scale such as climate change. Phytoplankton use carbon dioxide for photosynthesis and in turn provide almost half the oxygen we breathe. The larger the world\'s phytoplankton population, the more carbon dioxide gets pulled from the atmosphere, hence, the lower the average temperature due to lower volumes of this greenhouse gas. Scientists have found that a given population of phytoplankton can double its numbers about once per day. In other words, phytoplankton respond very rapidly to changes in their environment. Large populations of these organisms, sustained over long periods of time, could significantly lower atmospheric carbon dioxide levels and, in turn, lower average temperatures. Carbon can be "stored" in oceanic sediments when organic matter sinks and is buried in the ocean floor.
Understanding and monitoring phytoplankton can help scientists study and predict environmental change. Since phytoplankton depend upon sunlight, water, and nutrients to survive, physical or chemical variance in any of these ingredients over time for a given region will affect the phytoplankton concentrations. Phytoplankton populations grow or diminish rapidly in response to changes in its environment. Changes in the trends for a given phytoplankton population, such as its density, distribution, and rate of population growth or diminishment, will alert Earth scientists that environmental conditions are changing there. Then, by comparing these phytoplankton trends to other measurements - such as temperature - scientists can learn more about how phytoplankton may be contributing to, and affected by, climatic and environmental change.
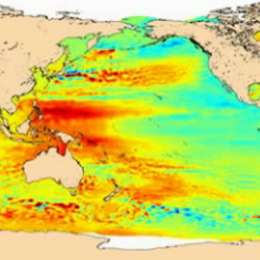
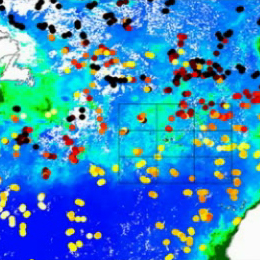
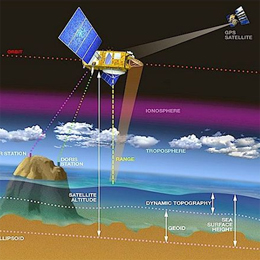
Sea surface height variation and mean sea level applications from radar altimetry.
Radar altimetry satellites have been measuring the whole Earth’s ocean since 1991. Currently Jason-2, Envisat and Jason-1 are operational. Their main objective is the measurement of sea surface height variations. With a twenty-years long time series, the possibilities for climate studies are wide. We will describe roughly the data processing and uses, but mostly insist on two different applications:
Retrieval of wave parameters with Altimeter; Wind and wave from radar altimetry satellites: measurements and uses.
Radar altimetry satellites have been measuring the Earth’s ocean since 1991. Currently Jason-2, Envisat and Jason-1 are operational. If the main objective of those are the measurement of sea surface height, wind speed (modulus) and significant wave heights are very useful - bonuses - to these techniques. The presentation will explain how these quantities are retrieved from the altimeter measurements, and how they are used in meteorology, climatology and oceanography.
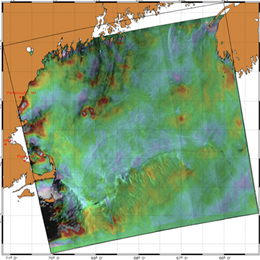
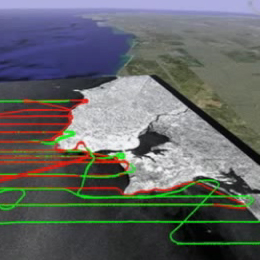
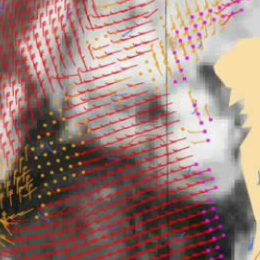
Presentation on SAR image analysis and on the interpretation of oceanic and atmospheric phenomena, with examples of signatures of downbursts, convective cells and sea/land breezes. Also, the retrieval of high resolution wind speed with SAR will be addressed.
Synthetic-aperture radar (SAR) is a form of radar whose defining characteristic is its use of relative motion between an antenna and its target region to provide distinctive long-term coherent-signal variations that are exploited to obtain finer spatial resolution than is possible with conventional beam-scanning means. It originated as an advanced form of side-looking airborne radar (SLAR).
SAR is usually implemented by mounting, on a moving platform such as an aircraft or spacecraft, a single beam-forming antenna from which a target scene is repeatedly illuminated with pulses of radio waves at wavelengths anywhere from a meter down to millimeters. The many echo waveforms received successively at the different antenna positions are coherently detected and stored and then post-processed together to resolve elements in an image of the target region.
Current airborne systems provide resolutions to about 10 cm, ultra-wideband systems provide resolutions of a few millimeters, and experimental terahertz SAR has provided sub-millimeter resolution in the laboratory.
SAR images have wide applications in remote sensing and mapping of the surfaces. In this presentation the applications for monitoring the ocean surfaces are discussed.
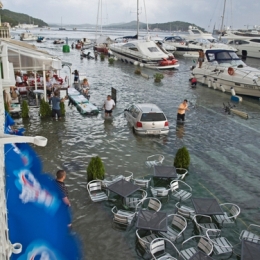
On 15 August 2008, at about 17 UTC, a sea wave flooded the harbour of Mali Losinj on the island Losinj in the northern Adriatic.
On 15 August 2008, at about 17 UTC, a sea wave flooded the harbor of Mali Losinj on the island Losinj in the northern Adriatic. The flood was about 50 to 80 cm high above the ground what, together with the height of the ground above mean sea level, gives the wave height (trough-to-crest) of more than 2 m. This study is aimed to show that the flooding was caused by a Meteo Tsunami.