
Weather
The extra tropical transition (ETT) of Hurricanes over the Atlantic is something that happens about 5 times a year and can severely disrupt the weather forecast.
The extra tropical transition (ETT) of Hurricanes over the Atlantic is something that happens about 5 times a year and can severely disrupt the weather forecast. In this CAL the important features of ETT are addressed and physical theories are presented. After each chapter several exercises allow you to test the theory.
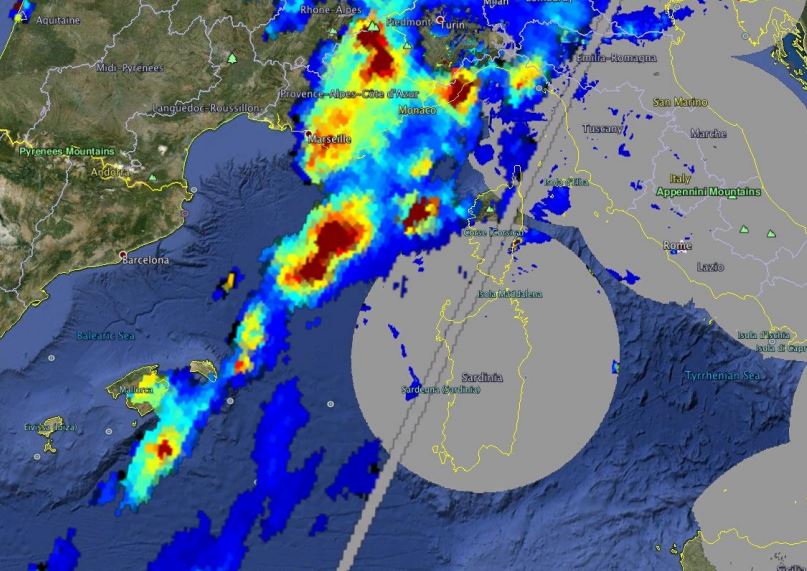
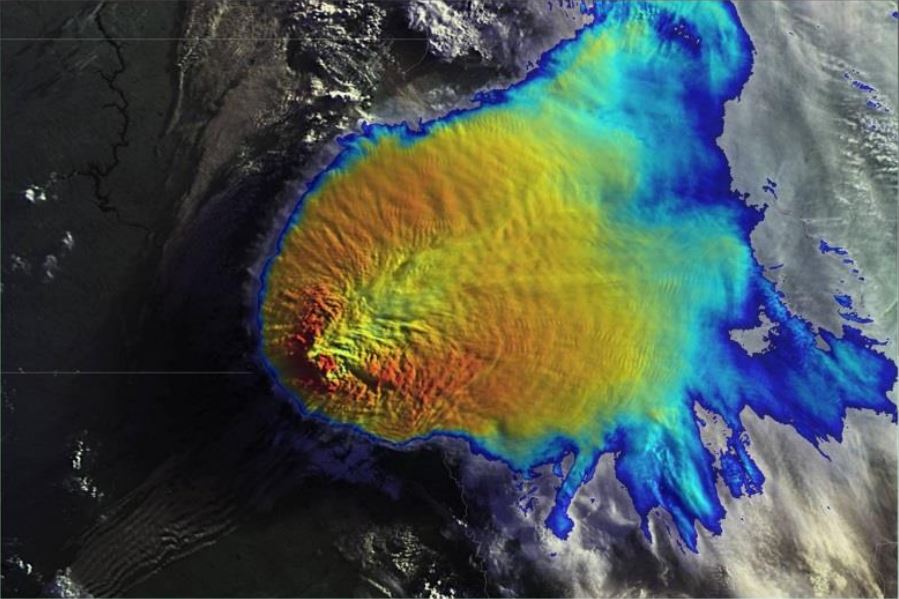
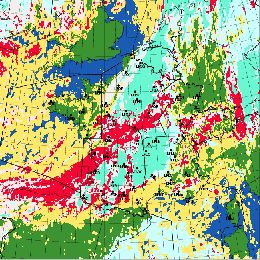
Marie Doutriaux-Boucher presents the Multi-Sensor Precipitation Estimate (MPE) product from EUMETSAT.
Length: 30 min
Author: Marie Doutriaux-Boucher (EUMETSAT)
Since 2004, EUMETSAT is deriving the Multi-Sensor Precipitation Estimate (MPE) product operationally. The MPE product retrieval is based on a blending technique that uses microwave information from SSMI-S instrument onboard DMSP-F16 polar satellite and infrared information from the Spinning Enhanced Visible and Infra Red Imager (SEVIRI) instrument onboard MSG geostationary satellites. It consists of a rain rate given every 15 minutes at MSG pixel resolution (3x3km2). Although the retrieval is not a state-of-the-art technique, the product has proven to be quite robust and valuable for deep convective precipitation detection. This presentation will present the MPE product and show some example of potential improvements for future SEVIRI precipitation product.
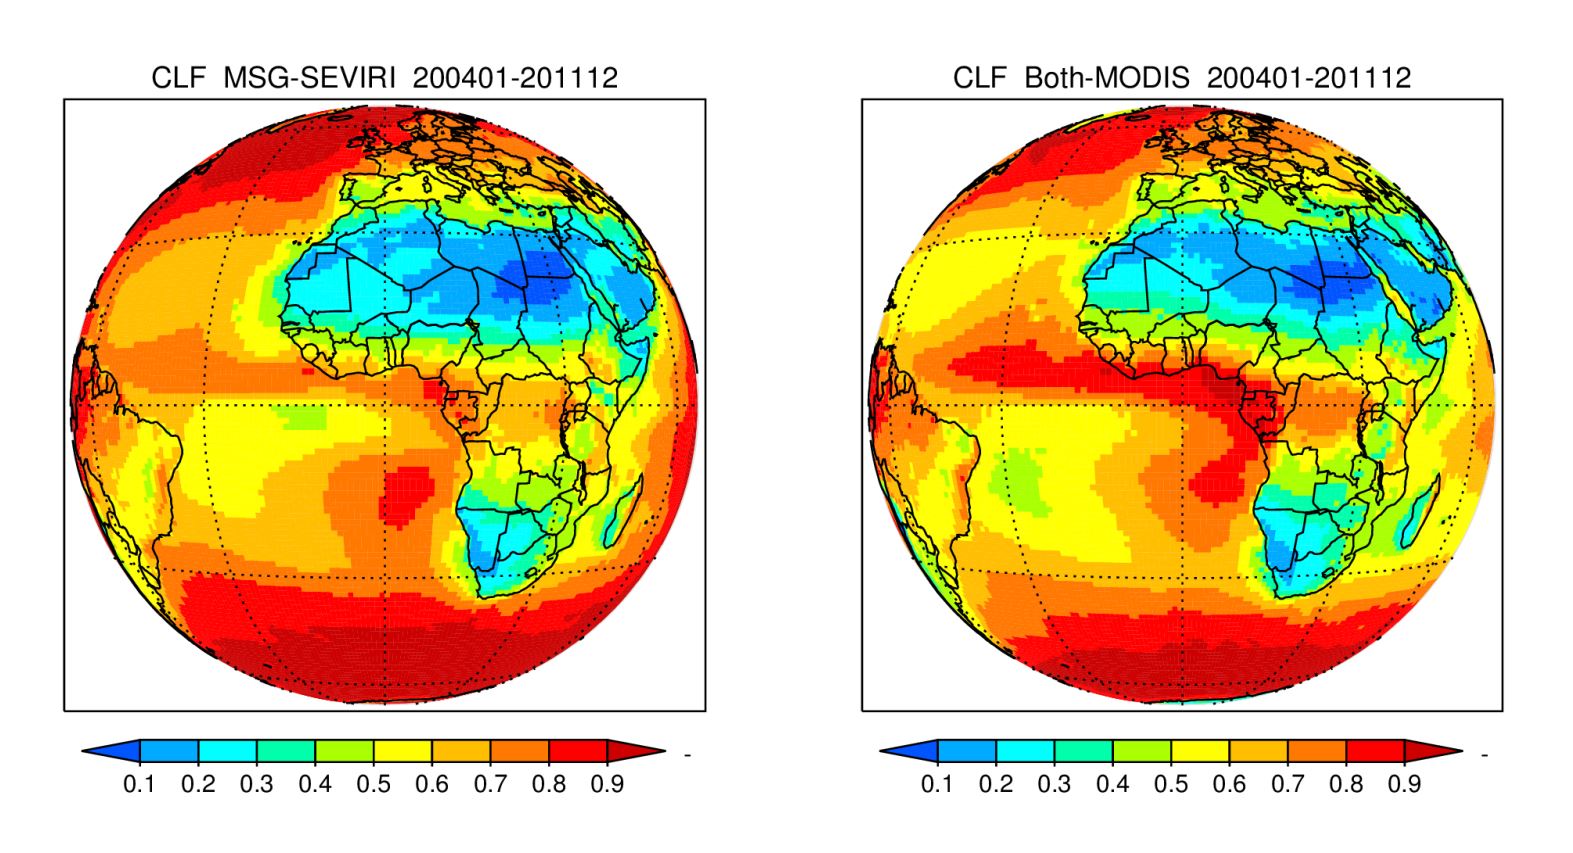
Jan Fokke Meirink speaks about the algorithms developed for the retrieval of daytime cloud physical properties from MSG-SEVIRI.
Length:
Author: Jan Fokke Meirink (KNMI)
Within the CM SAF we have developed an algorithm for the retrieval of daytime cloud physical properties from MSG-SEVIRI. This algorithm and the retrieval products will be described. Furthermore applications will be discussed with a focus on convection.
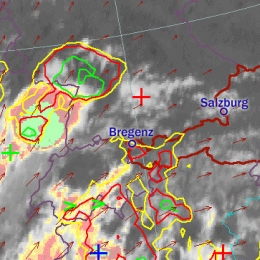
Matteo Picciani presents the recent upgrades and future developments of the H-SAF products for the monitoring of convective precipitation.
Length: 30 min
Author: Matteo Picchiani (CNMCA)
In the presentation the recent upgrades and future developments of the H-SAF products for the monitoring of convective precipitation will be highlighted. The application of a new version of NEFODINA, a tool developed by CNMCA for the detection of convective systems, will be introduced and different improvements such as the application of a calibration formula and the release of new products versions, developed for monitoring the MSG SEVIRI full disk area, will be shown.
Liliane Hofer presents alpine pumping as a major mechanism for convection related to orography.
Length: 30 min
Author: Liliane Hofer (ZAMG)
Mountainous regions tend to be the starting point for convective developments due to their elevated heat sources, the topographic amplifying factor or their role as a flow obstacle. In this presentation different synoptic situations and the consequent convection will be analyzed in the Alpine region on the hand of case studies.
Georg Pistotnik talks about the role of vertical wind shear in storm organization.
Length: 30 min
Author: Georg Pistotnik (ZAMG)
Next to sufficient instability, strong vertical wind shear is the main driver that promotes thunderstorms to organize into multicells, supercells or lines, which are more probable to attain a longer lifetime and to produce severe weather phenomena like hail or wind gusts. The role of vertical wind shear in storm organization is explained in this presentation, and selected case studies illustrate how favorable conditions for severe storms can evolve either by large-scale processes or, more challenging for forecasters, by local modifications of the wind systems and associated temperature and humidity changes.
In this module the basics and advantages of Nowcasting are explained.
In this module the basics of Nowcasting in the forecast room are explained. Its practical use in the weather room is explained with a series of examples.
The second part deals with explanation and testing of Nowcasting for various situations such as convective events, frontal situations or Fog. By adding more source-material a student is taught how to improve his Nowcasting skills.
This module will demonstrate the usefulness of the water vapour channels in forecasting.
Water vapour images have traditionally been used as additional information which tells about the air streams and water vapour content in the upper and middle levels of the troposphere.
Water vapour is a trace gas, that tells about the origin and kinematics of an airmass. In this respect water vapour images can reveal features that Infrared or Visible channel images are not capable of showing.
Since the introduction of RGB techniques in satellite products, water vapour information is been used more and more in these RGB combination images. Water vapour information is particularly important in Airmass and Severe Storms RGB products.
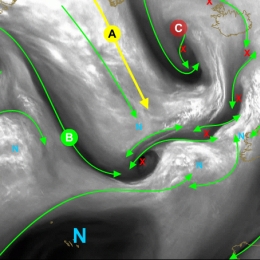
This module takes a closer look at vorticity maxima and minima signatures in satellite imagery.
Vorticity patterns control the circulation of air masses in their vicinity. By doing this they control the location of important meteorological quantities that are essential for an accurate diagnosis and forecast of the atmosphere.
The scale of vorticity patterns in the atmosphere ranges from large-scale synoptic system circulations (low and high pressure centres) to smaller meso-scale circulations (water vapour vortices (sometimes referred as WV eddies or WV eyes). The (anti-)cyclonic rotation in the atmosphere caused by a vorticity maxima is easily seen in satellite imagery. And quite naturally, satellite imagery is the key tool to correctly locate the maximum of cyclonic and anticyclonic vorticity in the atmosphere. Moreover, satellite images are able to show the small-scale vorticity patterns that are easily overlooked and smoothed out by a NWP model.
This training module has been developed to teach you to identify these vorticity centres in Meteosat Second Generation (MSG) satellite imagery. In addition the module will provide you with a firm physical background to help you understand why it is important to do a good diagnosis of satellite images and also provide you with a range of examples and exercises to demonstrate the impact a vorticity centre may have on your weather forecast.
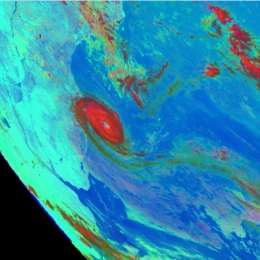
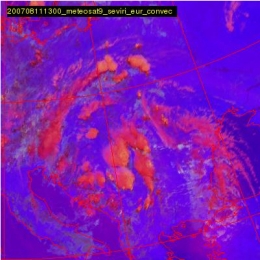
An intensive training module on the operational use of RGBs in the forecasting room.
Technological advances and the increasing sophistication of weather forecasting have created a demand for more frequent and more accurate and higher resolution observations from space. To meet this demand on 28th August 2002 the first of four satellites known as Meteosat Second Generation (MSG) was launched.
MSG transmits more than 20 times the information of its predecessor. The improved resolution of frequency of data significantly contributes to the accuracy of both short-term and medium range weather forecasts. Since 2004, the MSG satellites have been providing full Earth disc images every 15 minutes, in 12 spectral bands.
Twenty times more information is also a challenge for the user to cope with. To present all of this extra data in a understandable way to the user, so-called RGB (red, green and blue) images were developed that allow you to easily make a qualitative analysis. In RGB images the different properties of the twelve spectral bands of MSG are combined in one powerful coloured image.
Fog, snow, atmospheric dust, SO2 clouds from erupting volcanoes, severe updrafts in convective systems, Potential Vorticity (PV) anomalies are just a few keywords and applications that we will teach you to recognise in satellite imagery. On several occasions questions and exercises will help you to test your gained knowledge.
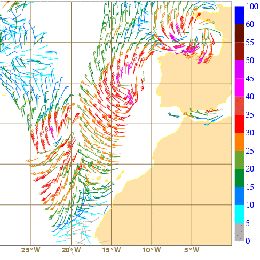
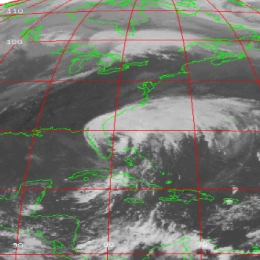
Storm Xynthia developed over the North Atlantic in late February 2010. The ASCAT sensor of EUMETSAT MetOp-A satellite tracked its evolution and provided insight into the life cycle of the storm.
This case study covers the development of storm Xynthia. Xynthia evolved out of a low pressure system which formed east of the Bermuda and lasted for 8 days. The storm was well depicted in satellite imagery and showed strong convective activity over the Atlantic. When approaching Western Europe and crossing Northern Europe, Xynthia was mainly a windstorm with gusts exceeding 150 km/h. The module briefly describes the functional principle of the ASCAT sensor and illustrates how measurement is performed and wind speed is retrieved. A comparison of ASCAT winds with NWP and surface winds is given, showing the benefits and drawbacks of each data source. Chapter 2 of the case study investigates the storms life cycle. In combination with satellite images, ASCAT wind data are plotted revealing deeper insight into the wind circulation close to ocean surface. The detailed analysis of the wind fields shows additional information on the position of the surface fronts and the location of pressure minima. Ongoing measurements of wind speed and direction from ASCAT is compared with NWP data and surface observations. The life cycle of storm Xynthia, from its real beginning over the Atlantic until its filling over the North Sea, is followed. During this time, Xynthia was covered 8 times by overpasses of the ASCAT sensor.
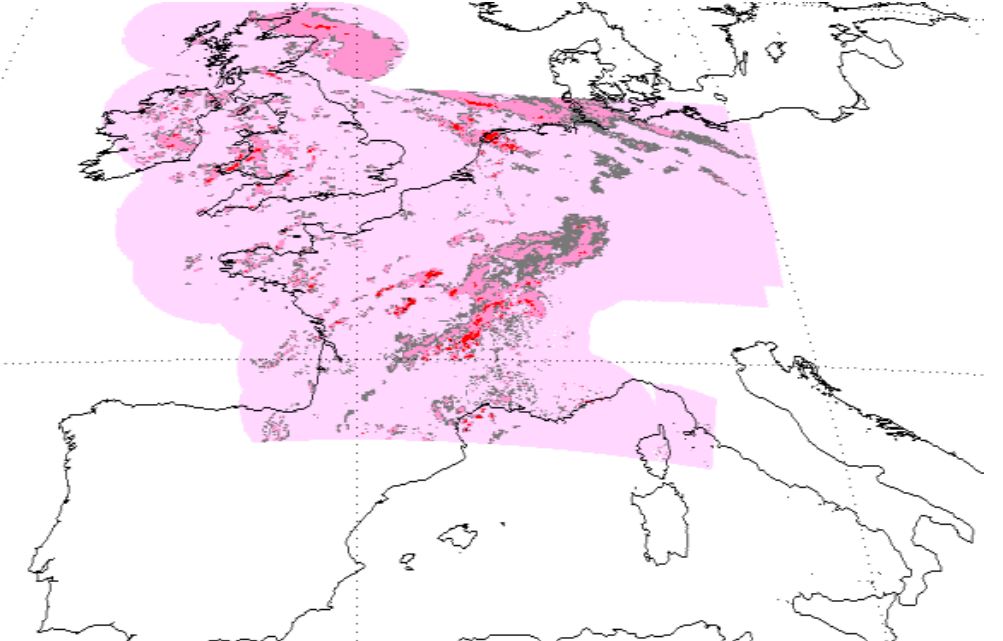
Icing still represents a major threat to aviation. This CAL module focuses on the occurrence of icing in stratiform clouds. A method to detect icing probability from satellite images in combination with radar and radiosonde data is presented.
Ice formation on wings and inside of the jet engine of planes causes around 15% of weather related aircraft accidents. Most icing occurs inside cumulonimbus clouds when supercooled droplets freeze with contact of the aircraft body. But also in stratiform clouds icing represents a major threat to aircrafts during landing and take-off phase. In this CAL module, icing hazards related to stratiform clouds are examined. The introductory chapter focuses on the different types of icing and the physical principles leading to ice formation on aircrafts. Satellite products from geostationary and polar orbiting satellites help differentiating between ice and water clouds. A sample of satellite images and products illustrate this capability. Additional data sources like radiosoundings and radar imagery are useful completions to the satellite data. Interpretation of radiosoundings in view of icing occurrence is the main topic of chapter 4. The usefulness of radar data for detecting ice clouds is demonstrated. Three case studies complement the theoretical part of the training module, showing typical weather situations where severe icing represented a serious threat to aircrafts in the past. These case studies combine the above mentioned data sources in the frame of a practical situation. The CAL module finishes on a suggested procedure for nowcasting icing from stratiform clouds. Exercises offering the possibility to test the acquired knowledge form the end of this module.