Xynthia filling up in the North Sea
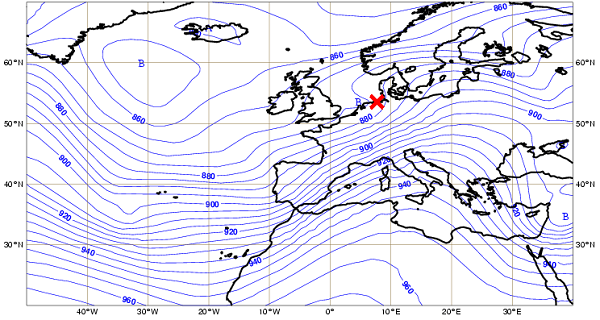
After landfall in France, the storm moved along the coastlines of Belgium, the Netherlands and Germany. Xynthia was now weakening, with a mean sea level pressure of 976 hPa at 18:00 UTC on the 28th over the Dutch/German border according to ECMWF analysis (Figure 2.7.1). Since its genesis, Xynthia was characterized by an upper level wave rather than a sharp trough. However, a short through could be detected in the upper levels at 18:00 UTC on the 28th (Figure 2.7.2).

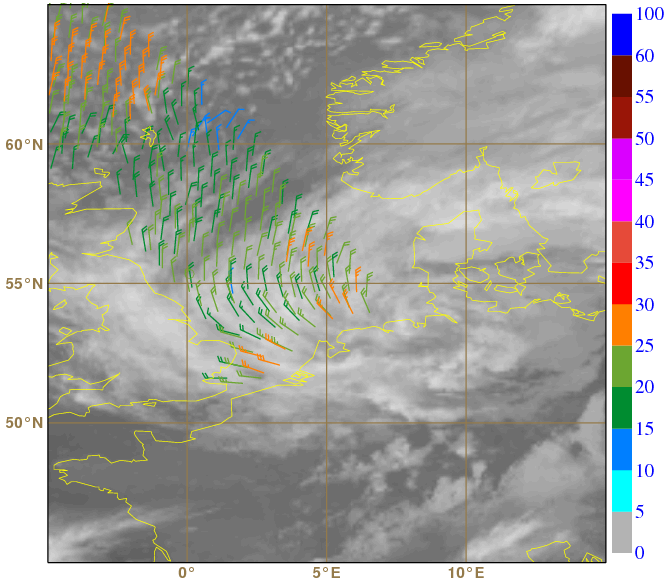
The ASCAT view of Xynthia over the North Sea in the late afternoon on the 28th was basically a glimpse of the northwestern part of the storm (Figure 2.7.3). In fact, the closest MSG IR10.8 image (at 19:45 UTC) and in-situ wind observations (at 20:00 UTC, see Figure 2.7.4) are better tools for identifying the centre location at that time, when it was already close to the German/Danish border.
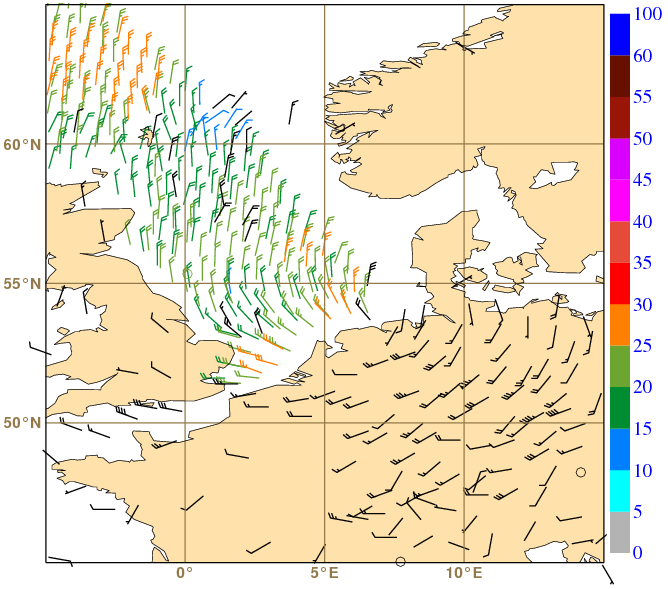
Although ASCAT wind speeds were now below the 30 kt threshold over the North Sea (Beaufort 6 to 7), the storm still presented strong and damaging winds in the south quadrant - see for example a 75 kt (~140 km/h) mean wind report in a SYNOP observation at 20:00 UTC in Figure 2.7.4. At this time Xynthia became associated with one casualty in Belgium and four in Germany, as well as with electricity and aviation disruptions in the affected regions.