Approaching shore
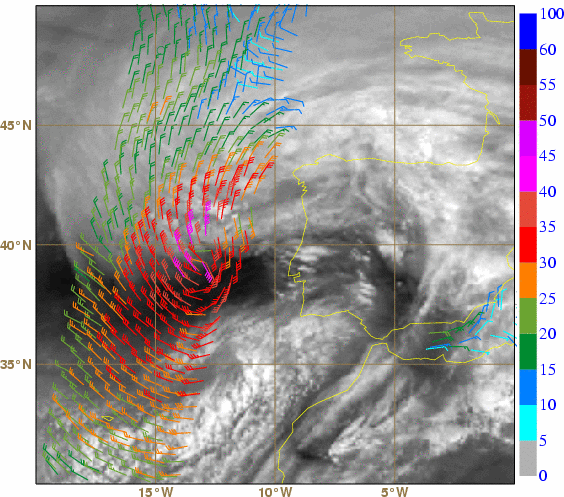
During the 27th, Xynthia started to approach the European continent. Around 10:30 UTC, ASCAT located Xynthia off the west coast of Portugal (Figure 2.5.1, top left), with maximum wind speeds in the 40-45 kt range (basically strong gale wind or Beaufort 9). As before, identifying the storm centre was difficult from MSG satellite images alone. The HRV RGB at 10:00 UTC (Figure 2.5.1 top right) indicated that the centre of the storm was defined by warm low clouds (in light yellow), with the convective clouds with colder tops (in white bluish) only located in the north quadrant of the storm. This suggested again that Xynthia was still essentially a windstorm at the time and no longer a storm mainly associated with convective episodes. Using surface observations at 10:00 and 11:00 UTC (SYNOP, ship and buoy) along with MSG images one could conclude that only one centre existed, with a possible minimum of 970 hPa or even lower around 39°N 12.5°W (at 10:00 UTC) and 40°N 12°W (at 11:00 UTC) - see Figure 2.5.1, bottom. At 11:45 UTC the yellowish low clouds in the HRV RGB image defined a clear curl pattern, in what may have been one of the best representations of Xynthia's centre from MSG observations at this stage.
 |
 |
 |
 |
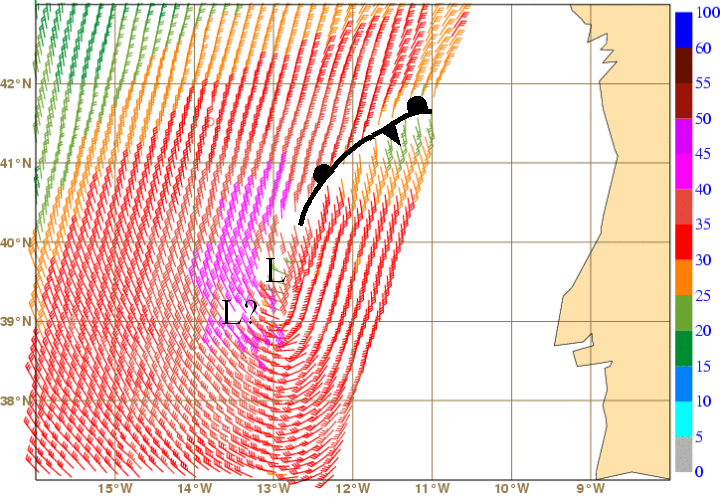
Looking in detail into the ASCAT wind pattern and surface pressure estimate from UWPBL (Figures 2.5.2 and 2.5.3), some additional interesting features emerge:
- The pressure minimum of 985 hPa by ASCAT/UWPBL suggests a clear overestimation by this algorithm, when comparing to the minimum pressure estimated through surface observations around 970 hPa (ECMWF MSLP 9h forecast for 09:00 UTC indicated 971 hPa at approximately 38°N 14°W and in the 12:00 UTC analysis it reached a minimum of 973 hPa). This overestimation by ASCAT/UWPBL can be either related to the boundary model characteristics or to a possible underestimation of wind speed by ASCAT. This may suggest the real wind to be stronger than Beaufort 9. Remember though that ASCAT still has a reliable range up to 50 kt (Beaufort 10), excluding wind speeds corresponding to Beaufort 11 and 12.
- Apart from the main pressure centre already mentioned, a second pressure minimum appears around 41.5°N 11.5°W (also 985 hPa), on the eastern edge of the plotted ASCAT swath. This may indicate either the existence of a secondary low, or simply a wave along the warm front that is carrying an airmass northwards ahead of Xynthia on its northeasterly trajectory.
- Around 39°N 13.5°W, opposing winds can be found in a pattern that, again, suggests the existence of a third centre. In this case, the overall northwesterly flow around the opposing winds may support the idea that the ambiguity removal scheme on ASCAT wind processing (see Chapter 1.2 for more details) may have not made the best choice in this case.

So far Xynthia (in its complex structure) had been moving "alone" over North Atlantic with two large surface ridges, one to the northwest and another to the northeast, isolating the storm. Throughout the 27th Xynthia, without losing its identity, entered into a larger complex low-pressure area to the north, the main centre of which was located west of the British Isles.
Also at this stage the role of upper levels seemed to be decisive, as dry stratospheric intrusions and the jet stream had a clear influence on Xynthia's dynamics. Accordingly, high values of vorticity advection and temperature advection at 300 hPa were found, as been happening since the 25th. At 06:00 UTC on the 27th, the upper geopotential disturbance caught up with the lower disturbance (still just a wave in the main large scale upper trough) so that the previous tilt upstream was lost. In the following hours they would still be in phase, but Xynthia would continue to deepen until 00:00 UTC on the 28th.