Final remarks on Xynthia and ASCAT
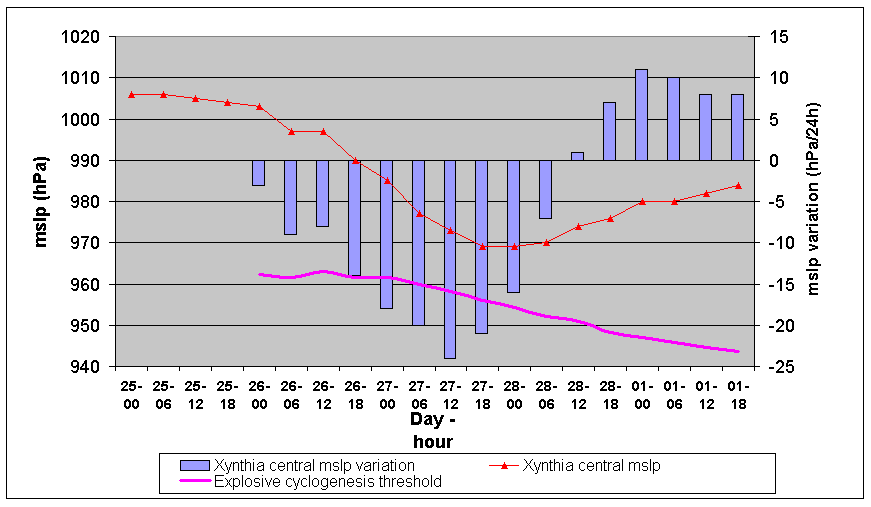
Xynthia was in a stage of explosive cyclogenesis during 27th February, taking into account Sanders & Gyakum's (1980) definition, which considers the threshold for central pressure decrease in 24 hours to be dependent on the latitude; it varies between less than 15 hPa around 30° latitude to 24 hPa at 60° latitude (Figure 3.1).
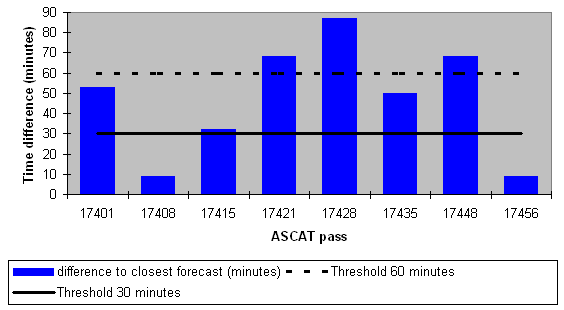
During its lifecycle, Xynthia was observed at eight instants by the ASCAT sensor onboard the METOP satellite. Although ASCAT did not always provide a full view of the storm's wind patterns due to its coverage limitations, the available images were useful in analyzing different stages of the storm's development.
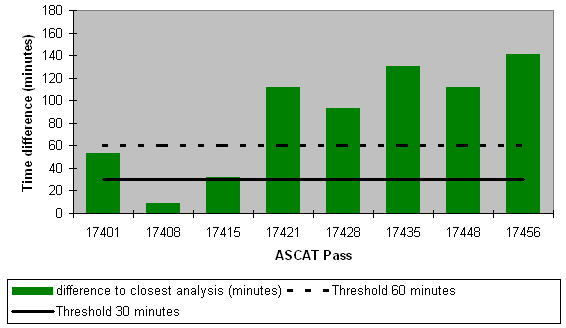
Regarding the comparison between ASCAT and ECMWF forecasts (Figure 3.2), one can conclude that only two out of the eight ASCAT passes were within the 30 minutes threshold and allowed a stricter evaluation of the forecast. Also, three more passes were within the 30 and 60 minutes thresholds and the three other passes were too distant in time from model forecasts. As for ECMWF analysis, only the first three passes were less than one hour apart - one pass within the 30 minutes threshold and two more within the 30 and 60 minutes thresholds (Figure 3.3).
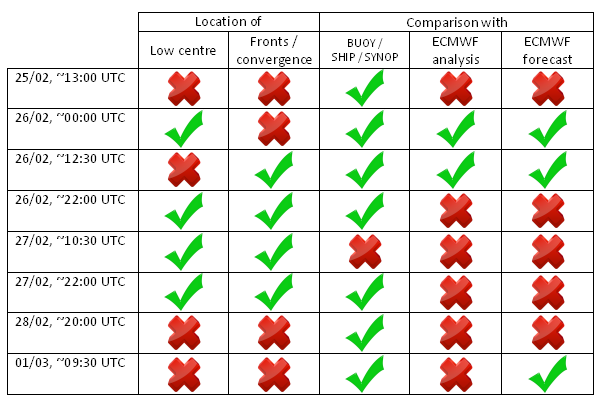
An overall evaluation of ASCAT's usefulness in Xynthia's analysis by a forecaster in near-real time is summarized in Table 3.1. Xynthia's centre and frontal/convergence wind patterns could be found in half of the passes. Comparison with in-situ observations was possible in all passes, except the one off the west coast of Portugal. Regarding comparison with ECMWF (up to around 30 minutes differences), there were only two passes close to the time of analysis and three close to the time of forecasts. This may seem disappointing at first, but comparing ASCAT with 1h step forecasts from limited area models (LAM) (not done in this case) may naturally reduce time differences and improve ASCAT's usefulness in this particular aspect. In Table 3.1 the number of green ticks and red crosses are coincidentally the same. Therefore, if all available LAM models had been used in this analysis, ASCAT wind would certainly have proved to be an even better tool for forecasting centres throughout Europe in the last days of February 2010.
Xynthia and international organizations: