The Baltic Sea and the end of Xynthia
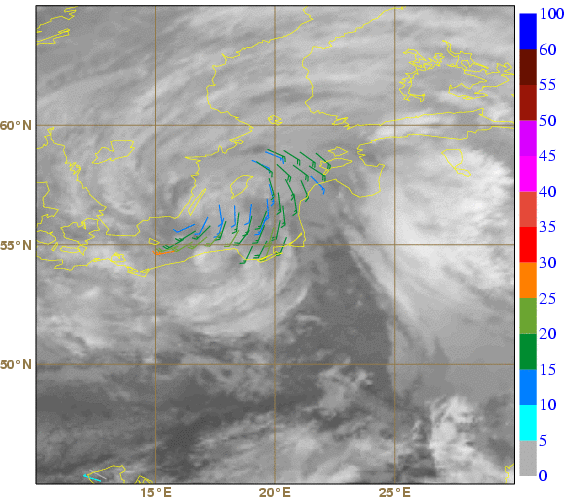
By the time it reached the Baltic Sea, Xynthia was no longer a cause for alarm for local forecasters. ASCAT did not depict the depression centre clearly, but nevertheless it depicted the wind patterns in Xynthia's southeast quadrant, with wind speeds below the 30 kt threshold (Figures 2.8.1 and 2.8.2).

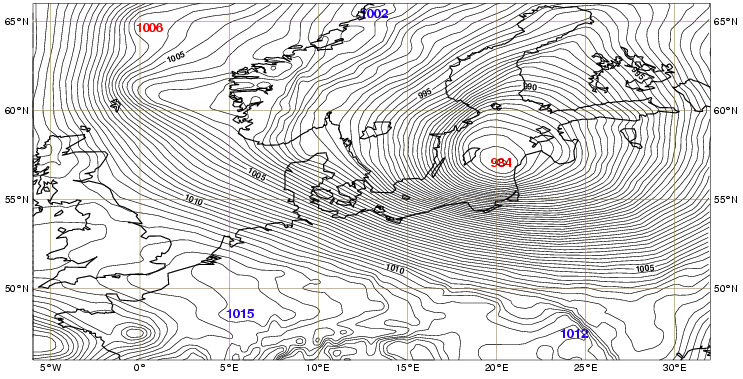
ECMWF forecasts after 25th February were all indicating a low-pressure system over the Baltic Sea area at this time. Remember that by the 25th the precursor disturbance that later become Xynthia was already present over a subtropical area of the North Atlantic and could be assimilated by the models. After the 25th, the minimum sea level pressure forecasts for the depression at 9:00 UTC on 1st March ranged from 978 to 988 hPa (10 hPa spread), depending on the run, while the surface observations suggested a minimum pressure of 982 hPa at that time. According to the forecasts since the 25th, three countries could have reclaimed the location of the low at this instant, as it changed in a box with 5° longitude and 2.5° latitude:
- Near Gdansk in the north coast of Poland (105 hour step, run 25th 00:00 UTC);
- South of Malmö, Sweden (93&81 hour steps, run 25th 12:00 UTC and 26th 00:00 UTC);
- Between the south of Sweden and Ronne island, Denmark (69, 57 and 45 hour steps, runs 26th 12:00 UTC and 27th 00:00 and 12:00 UTC);
- Close to Öland Island, Sweden (33, 21 and 9 hour steps, runs 28th at 00:00 and 12:00 UTC and 1st March at 00:00 UTC).
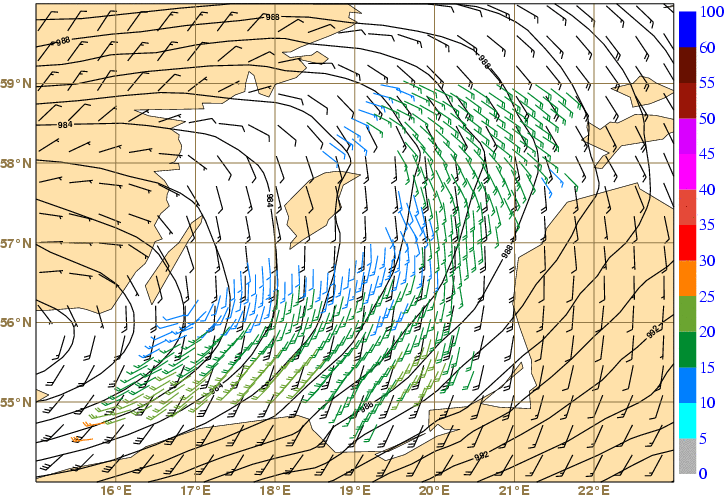
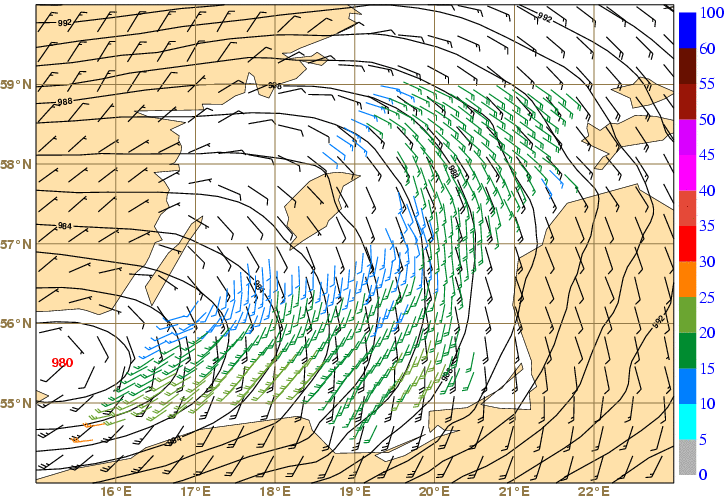
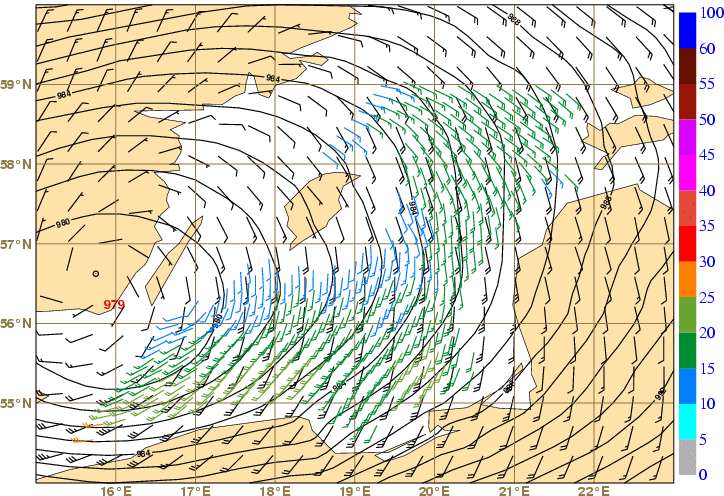
The superposition of ASCAT winds with forecasts at 09:00 UTC from the last four 00:00 UTC runs is shown in Figure 2.8.3 and depicts how the ECMWF model tuned Xynthia's centre location on consecutive runs, with slight eastward or northeastward shifts every day.
 |
 |
 |
 |
After the run on the 28th 00:00 UTC (33 hour step, lower left in Figure 2.8.3) the low centre remains over coastal Sweden, close to Öland Island. The location in the 9 hour step (lower right in Figure 2.8.3) fits best not only to surface observations, but also to the ASCAT wind pattern around 9:40 UTC, 40 minutes after the forecast time.
At 12:00 UTC on 1st March, Xynthia was still near the Swedish islands of Öland and Gotland also with 982 hPa in its centre (ECMWF analysis). During this day Xynthia slowed down, with an easterly displacement of 15-20 kt, which was clearly below the speed it had attained before. Despite its occlusion stage, there was still a warm sector, bringing milder air to these regions ahead of the storm. At 18:00 UTC Xynthia was located between Gotland Island and Estonia (Figure 2.8.4) and it continued its path towards the Gulf of Riga, making its last landfall late that day. Thereafter, Xynthia weakened in the northwestern part of Russia and, according to the University of Berlin (which named the storm in the first place!), made its last appearance on the weather charts on 5th March 2010.