The Bay of Biscay and a large storm surge
12 hours after passing the west coast of Portugal, ASCAT captured Xynthia once again, this time over the Bay of Biscay (Figure 2.6.1). In the meanwhile, the centre of Xynthia passed around 150 km off the coast of Portugal during the afternoon of the 27th, producing a 91 km/h (49.2 kt) wind gust in the coastal station of Viana do Castelo at 15:20 UTC. Xynthia already had caused 1 casualty due to a falling tree in a village in northern Portugal around 14:15 UTC. In the rest of country, greenhouses and electrical grids were damaged by strong gusts, with power outages lasting until the next day. Also, around 1000 occurrences of floods and landslides demonstrated that Xynthia was not only a windstorm after all.
During the afternoon Xynthia may have made a slight landfall in Spain, passing along Fisterra and Islas Sisargas, with the METAR observation from La Coruña showing a minimum of 969 hPa between 16:30 and 17:30 UTC. Near the coast, gusts peaked 98 km/h (53 kt) in La Coruña at 16:30 UTC and 100 km/h (54.1 kt) in Vigo at 15:30 UTC, with stronger gusts inland as high as 167 km/h (90.3 kt) throughout the day. Three casualties occurred in Spanish territory as a consequence.

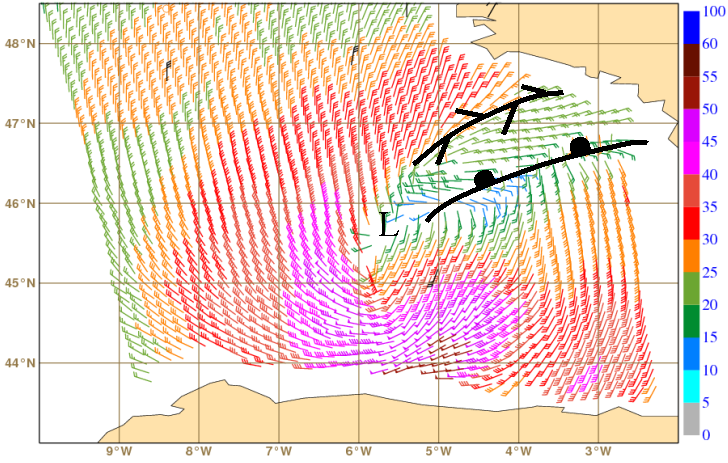
At 21:00 UTC Xynthia was again over the sea, with subjective surface analysis from available surface observations (SYNOP, SHIP and BUOY) suggesting a centre around 45°N 5°W with an MSLP value of 970 hPa or lower. However, the elongated shape of the MSLP field analysis over the Bay of Biscay, with a small trough stretching east-northeastwards, could suggest either the possibility of two centres or a frontal trough.
Around 21:50 UTC, the ASCAT wind pattern supported the possibility of a frontal trough, as it was consistent with a warm front located east-northeast of a dominating low around 45.5°N 5.5°W (Figure 2.6.2). ASCAT also clearly showed that there were now stronger wind speeds along Xynthia's southern border, with storm winds of 52.5-55 kt (Beaufort 10) at 44°N 5°W, that is, only 50 km off the Asturian coast (but outside the usually accepted reliable range for ASCAT). The ASCAT wind directions were consistent with BUOY/SHIP observations (in black barbs in Figure 2.6.2, obtained within 10 minutes of the ASCAT pass) but wind speeds were generally 5 kt weaker in ASCAT.
As a reference, the maximum wind speed was about 55 kt for the closest ECMWF forecast (around 1 hour before) and about 60 kt for the closest ECMWF analysis (around 2 hours later), both in the south quadrant of the storm. However, the time difference between these values and those from the ASCAT pass is too large for a straightforward comparison. This is especially true taking into account Xynthia's displacement speed of 30 kt over the area, which could lead to discrepancies of up to 1 degree in latitude even for a perfect fit between model and reality. Nevertheless, it should be stressed that the ECMWF model placed and defined Xynthia's intensity with a reasonable accuracy over the Bay of Biscay since the run on the 25th at 00:00 UTC. The forecasted location was even closer to its real location after the run on the 26th at 12:00 UTC (that is, by the time of the third ASCAT pass analyzed in this study (see chapter 2.3)), which was when Xynthia started to deepen.
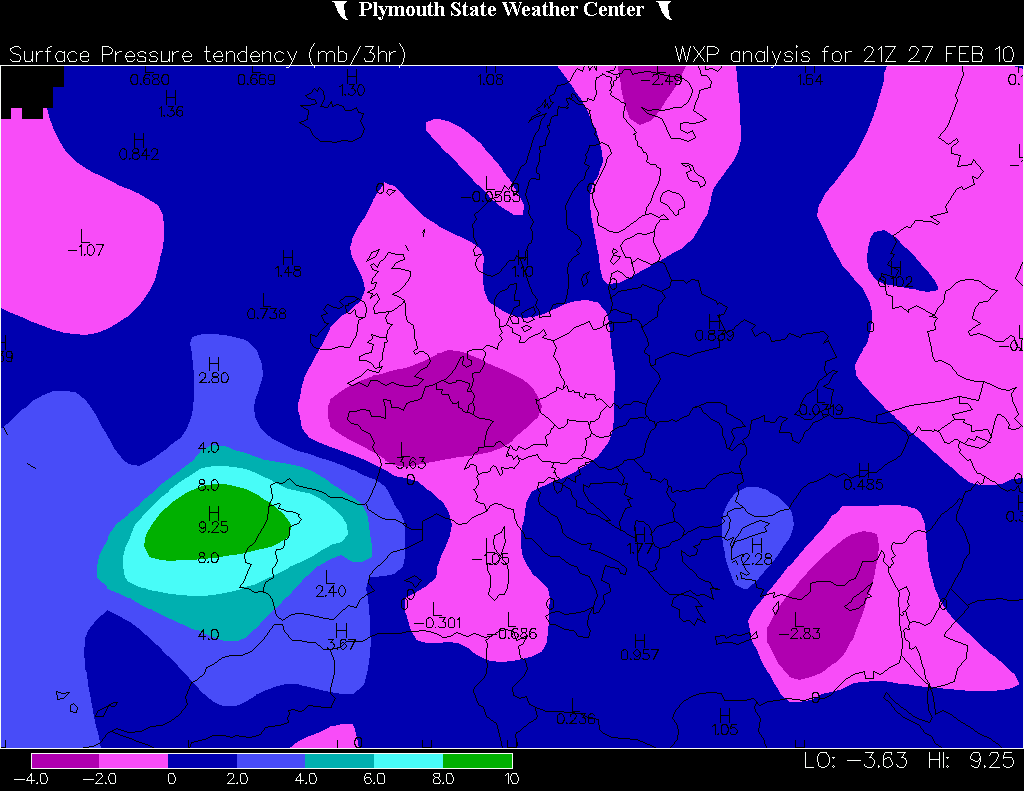
Since its genesis, Xynthia has shown an almost permanent surface pressure tendency dipole along its trajectory. In fact, not only did pressure drop very quickly but it also rose very quickly behind the storm. This could be seen very clearly at 21:00 UTC on the 27th (Figure 2.6.3). In its northeast trajectory across the Bay of Biscay, Xynthia's centre passed slightly to the north of the buoy located at 42.5°N 5°W, which had a minimum surface pressure of 969.4 hPa at 23:00 UTC and an intense pressure rise of 10 hPa in the following hour (Figure 2.6.4).
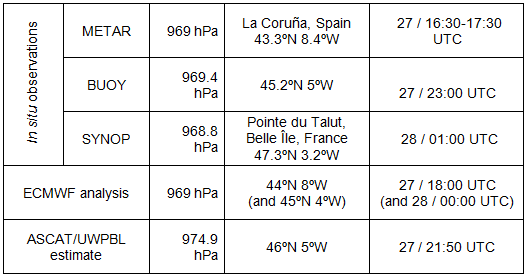
Xynthia, already in an occlusion phase, made landfall again, this time near Belle Île in France between 01:00 and 02:00 UTC on the 28th (see observations from the weather station Pointe du Talut in Figure 2.6.5). Table 2.6.1 summarizes the minimum MSLP values for this stage of Xynthia.
The pressure drop over the Bay of Biscay produced a strong storm surge on the coasts of Spain and France. An example of such a storm surge was depicted by MOG2D model output, which suggested a maximum sea level rise of 85 cm (Figure 2.6.6). In fact, the tide gauge of La Rochelle (Charente-Maritime Department) in France recorded a tide height of 8.01 m that corresponded to a storm surge of 1.53 m, resulting both from low surface pressure and high wind speeds. This storm surge height was not only the highest ever recorded since the instrument was installed in 1997, but was also higher than any height recorded in the Brest tide gauge (also on the French coast) in 150 years. The storm surge produced an extreme and vast flooding event in the coastal areas of the Charente-Maritime and Vendée Departments, which resulted in at least 53 casualties in France alone.