Clear air turbulence near billows and lee clouds
A characteristic pattern of cirrus clouds are billows. Often they are a strong signal for CAT. The billows are an indication of breakdown into turbulent flow in the form of Kelvin-Helmholtz instability. Then reason is velocity shear in the air. Have a look at this numerical simulation.
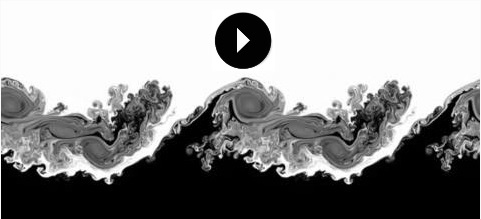
Animation 3.22: Numerical simulation of a Kelvin-Helmholtz instability [Wikipedia]
Note that even in the stratosphere, where static stability is high, turbulence and breaking waves can still be generated if the wind shear is strong enough. Values of Richardson number Ri (the ratio of potential to kinetic energy) less than 0.25 will allow the production of breaking waves. Values between 0.25 and 1.0 will allow turbulence to persist, whereas values greater than 1.0 will tend to cause any existing turbulence to subside. [WMO Aviation Hazards]
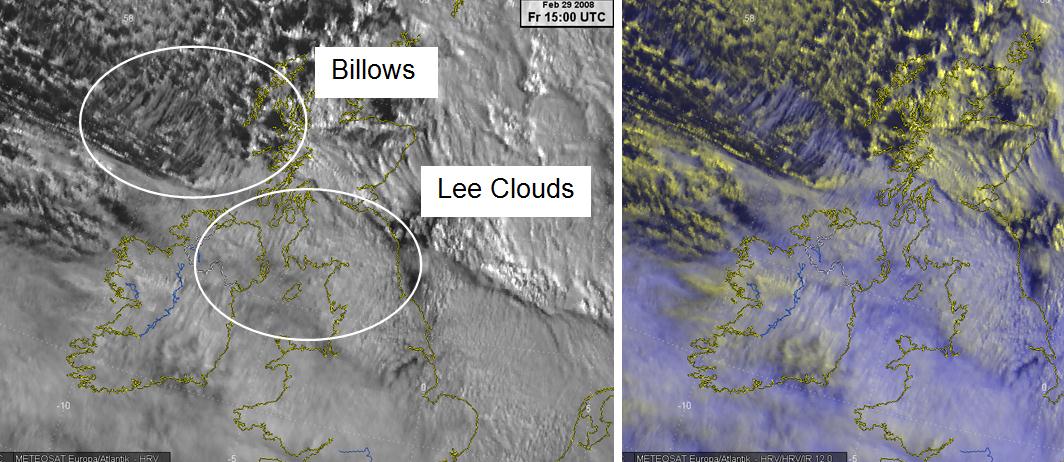
Fig. 3.23: HRV Fig. 3.24: HRV RGB
Fig. 3.24: HRV RGB
Both images: 29 Feb 2008, 15:00 UTC [DWD]
In the HRV RGB, we see (bluish) billows embedded in a very strong airflow over the yellow low clouds. There is a combination of billows and lee clouds over Great Britain and Ireland.
Mountain wave activity is often very apparent in satellite imagery. Trapped waves are often easily diagnosed, with very clear wave-like patterns in both infrared and visible imagery. Untrapped, or vertically propagating waves, are often indicated by orographic cirrus cloud features. In the figures above it is difficult to differentiate between the billows and lee clouds.
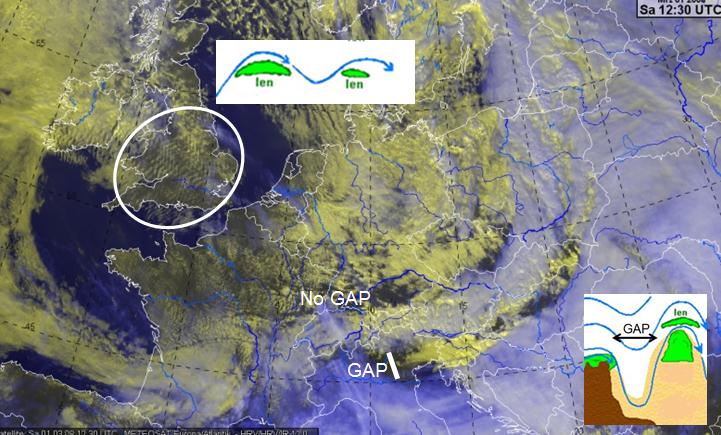
Fig. 3.25: 1 March 2008, 12:30 UTC, HRV RGB [DWD]
Lee waves generate lenticularis clouds over England and south of the Alps.
The circled area contains lee waves. Due to the strong winds, there is a high probability of clear air turbulence over these clouds.
Another sign of CAT is the gap between the mountain ridge and the thick cold cirrus clouds, caused by the strong wind shear. These clouds are bluish in the HRV RGB.
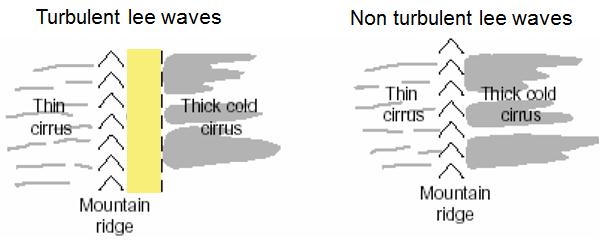
Fig. 3.26: The gap can be a sign of CAT [WMO Aviation Hazards]
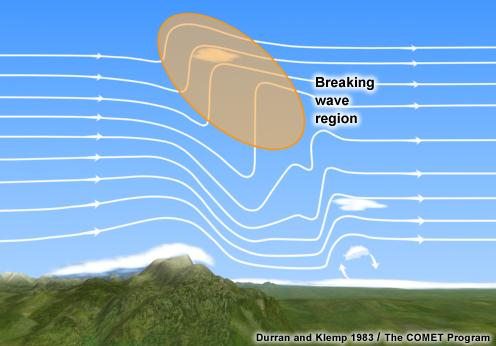
Fig. 3.27: Breaking wave region [COMET]
The gap is often a sign of vertically propagating waves of considerable amplitude. They may break in the troposphere or lower stratosphere. Wave-breaking can result in severe to extreme turbulence in that region and nearby. This typically occurs between FL200 and FL400 (6000 m – 12000 m). If a vertically propagating wave does not break, an aircraft would likely experience considerable vertical sway, but little turbulence.
In some cases of strong lee waves there is not enough moisture in the air for visible clouds to form. However, the lee cloud tops might be still seen in the Airmass RGB. They are easiest to see with polar orbiting satellites with a device for detecting water vapor, such as MetOp.
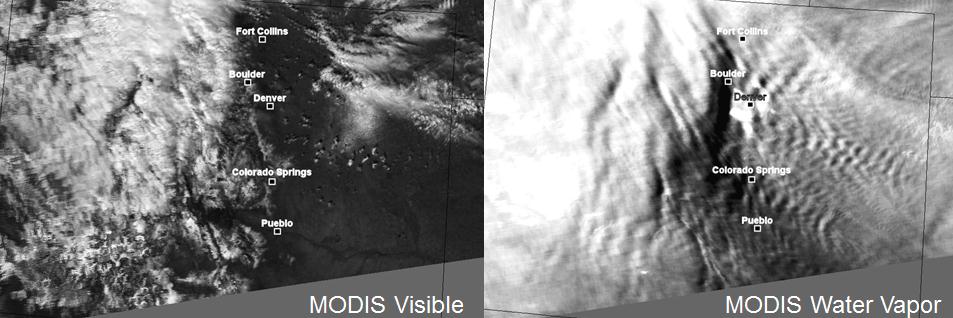
Fig. 3.28: Lee Waves without condensation in VIS and WV image [Wayne Feltz]