Chapter I: Introduction
Table of Contents
In this CAL module you will learn to detect areas with a risk of clear air turbulence. This will be done with the help of satellite images, soundings, flight reports and analyses of upper troposphere geopotential.
The module will help you to
- master the Significant Weather Chart (SWC) from the WAFC London
- publish and monitor text forecasts including Clear Air Turbulence (CAT)
- publish and monitor SIGMETs
- detect and monitor the course of the jet axis by comparing satellite images with the model output
- offer individual flight weather consulting for IFR flights
Detection of turbulence with different measurements
Observe the following images:
a) 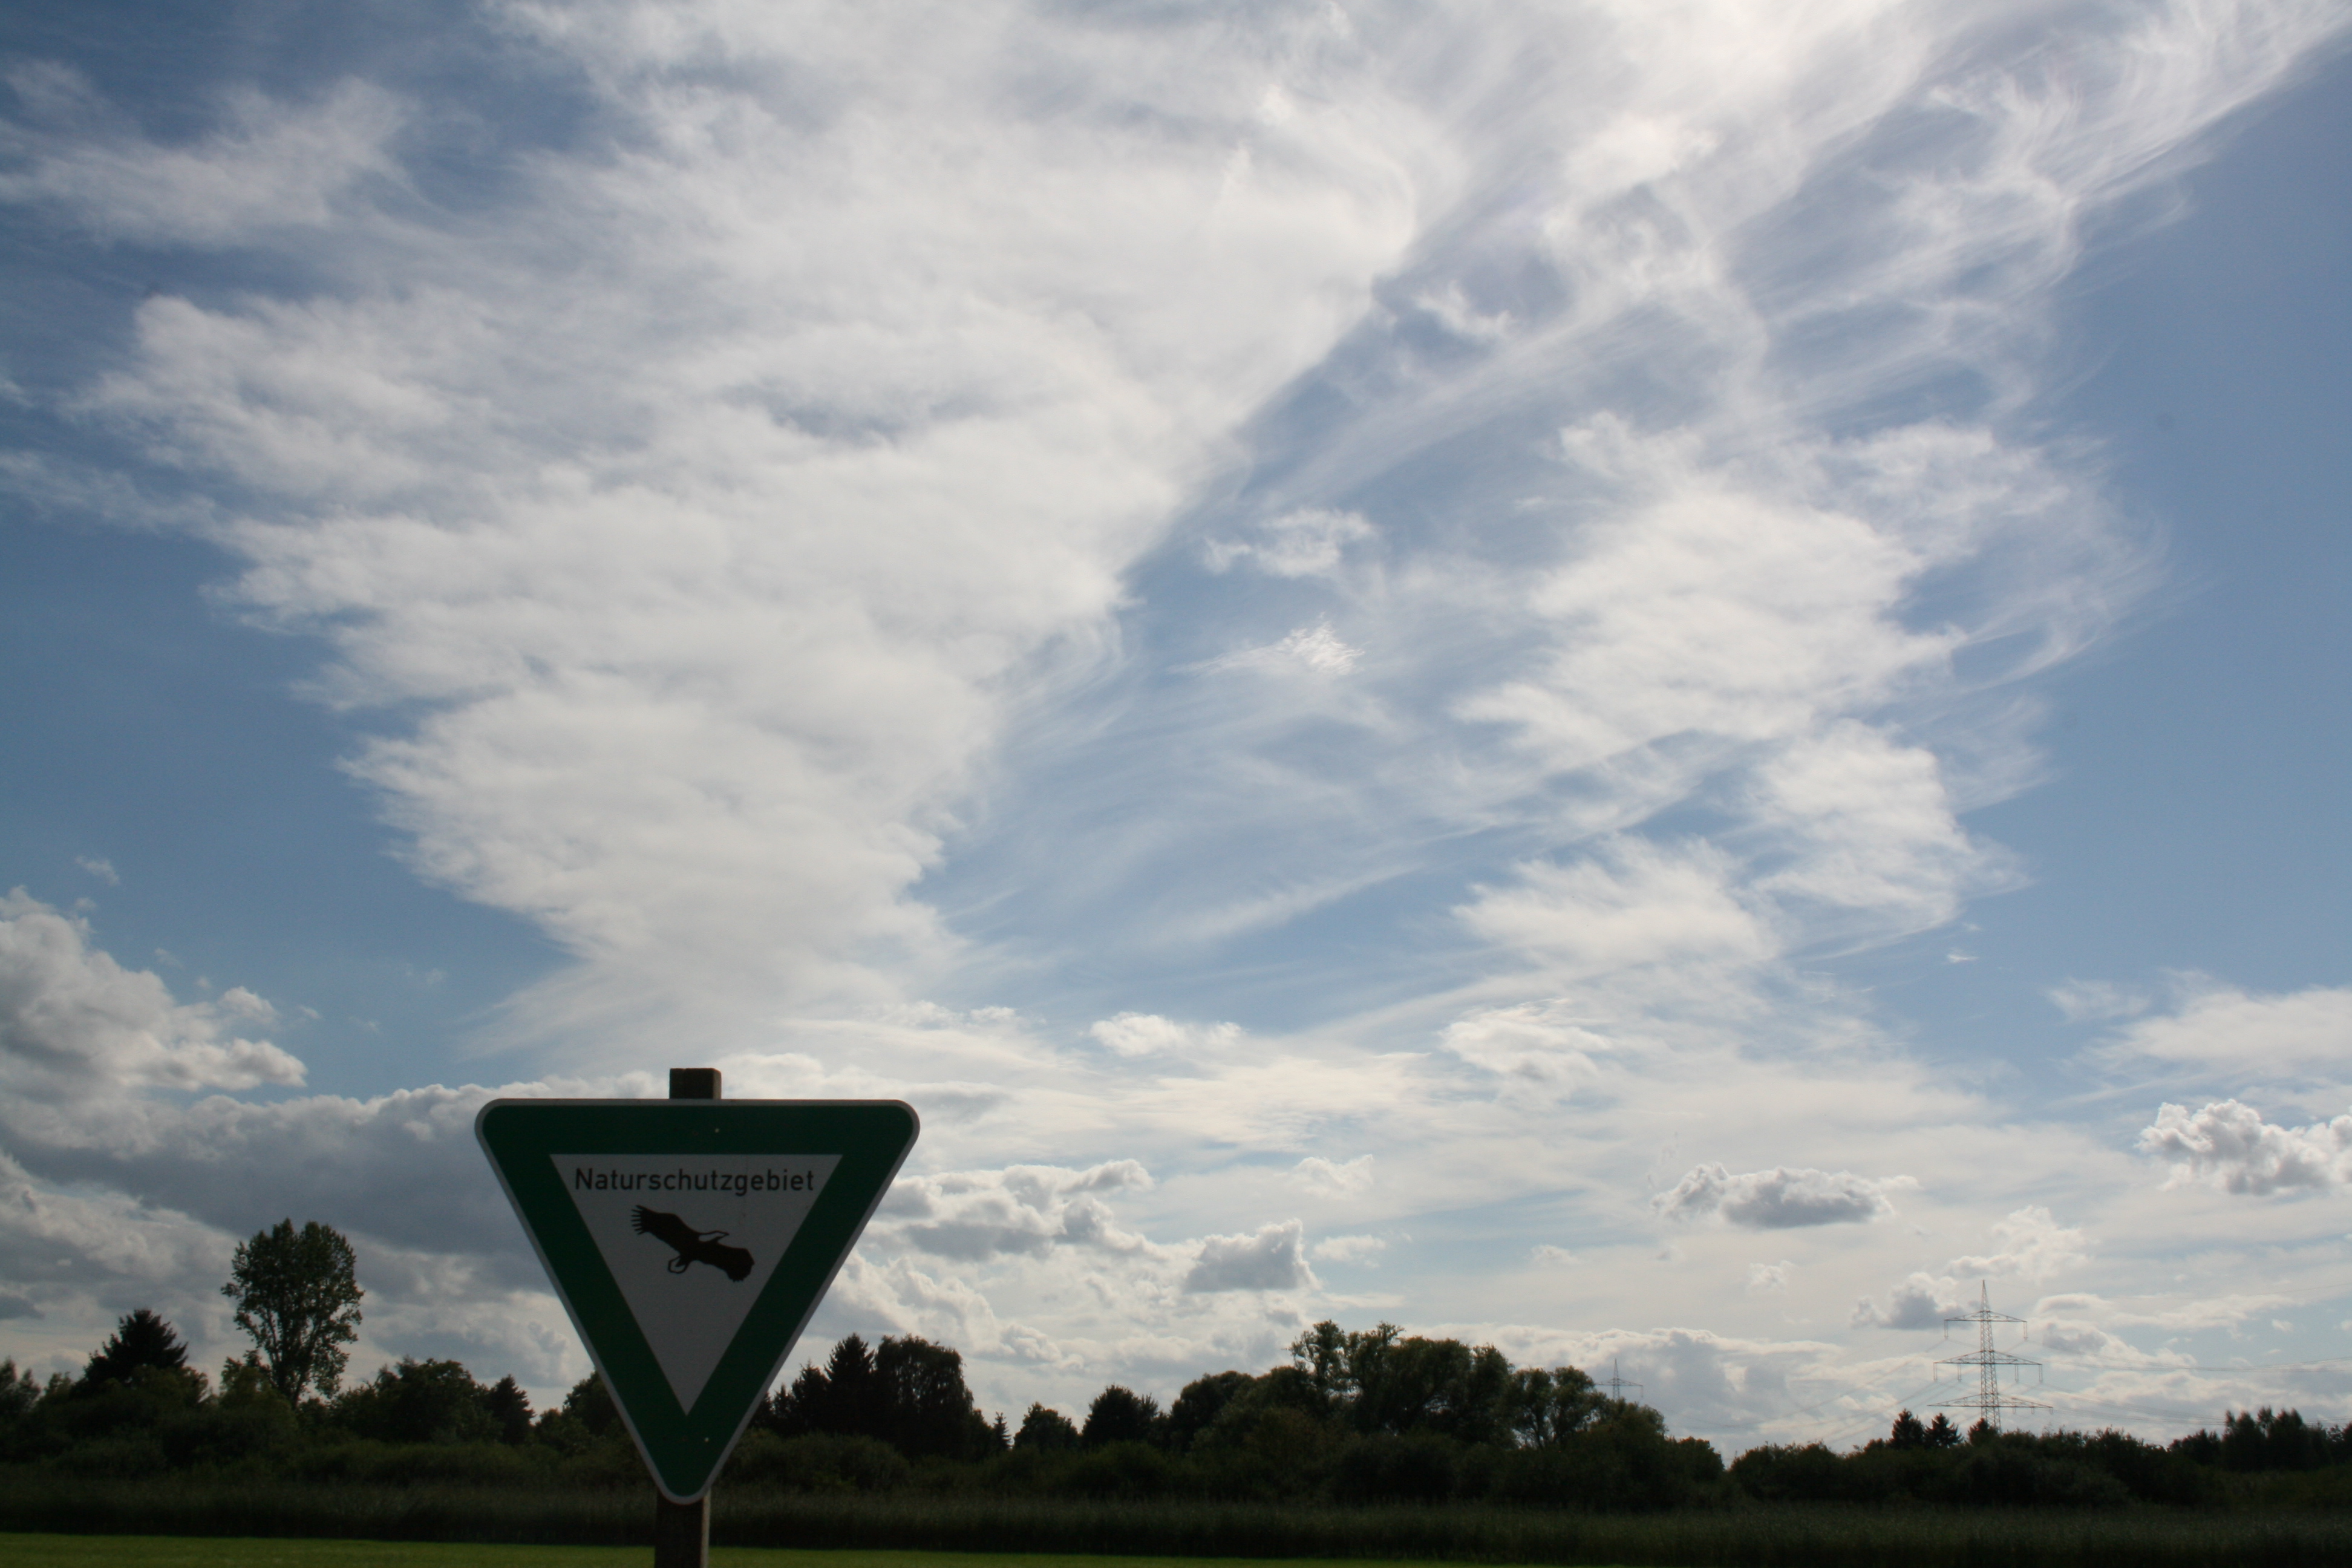 |
b) 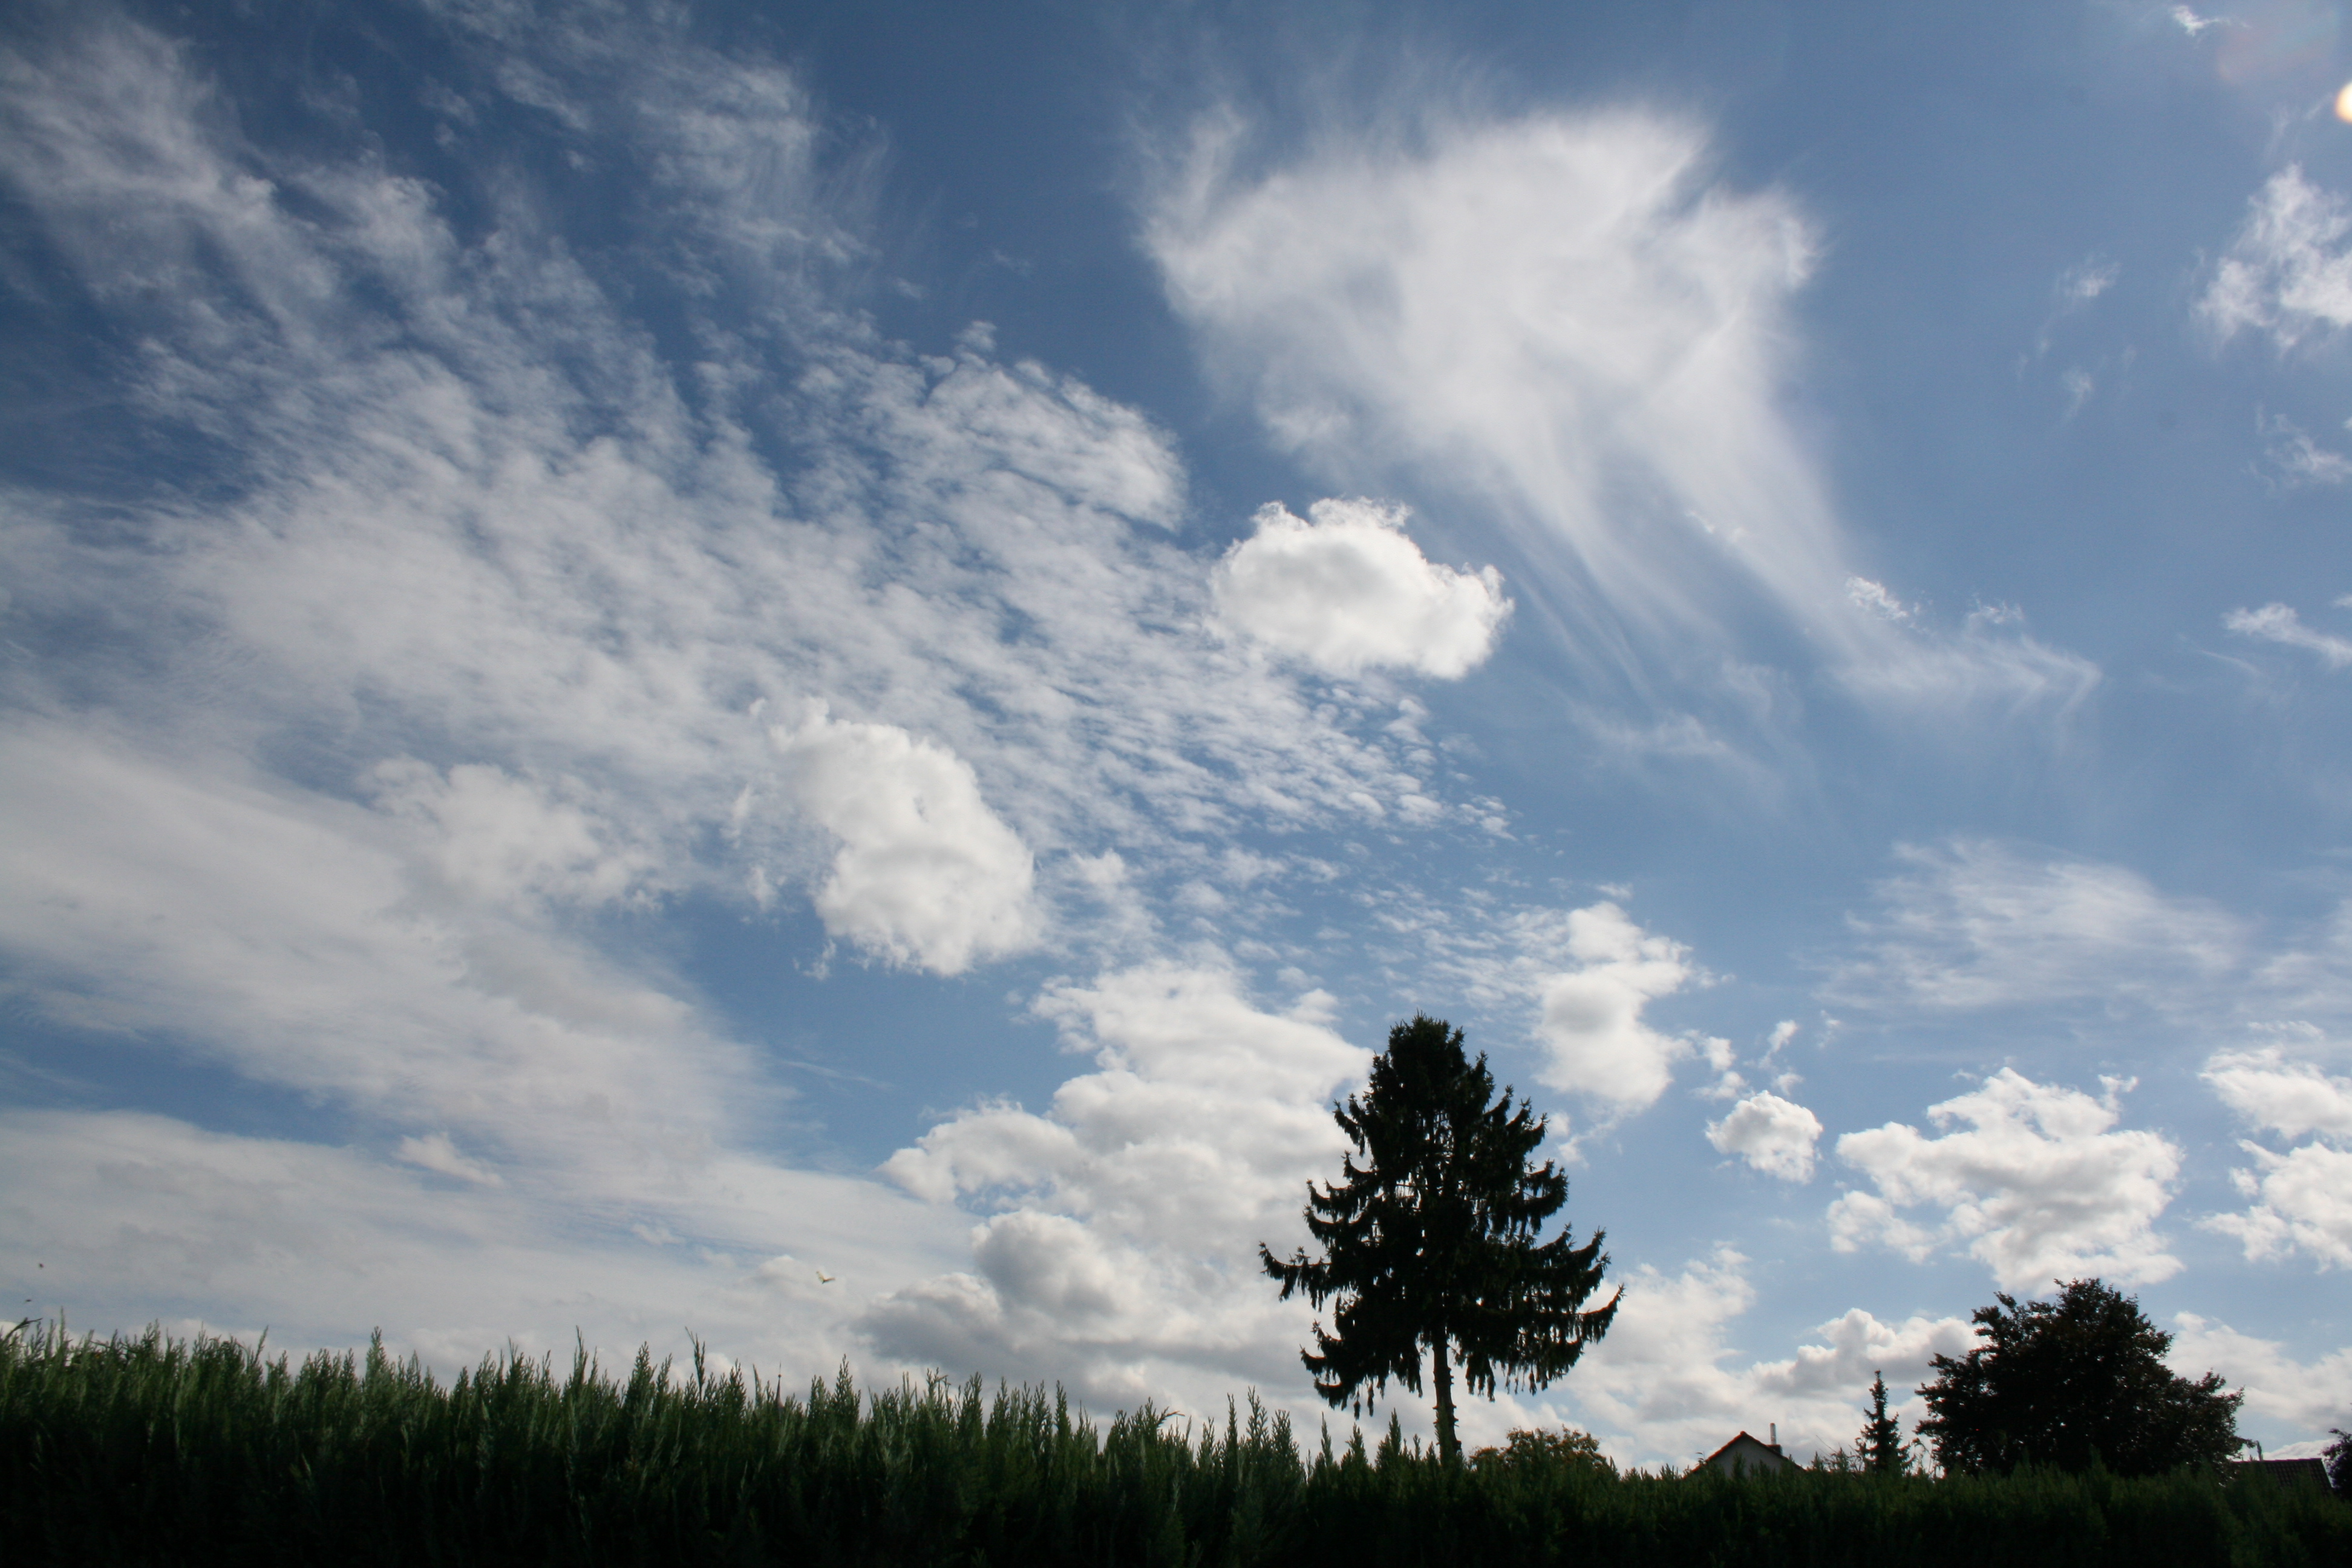 |
c) 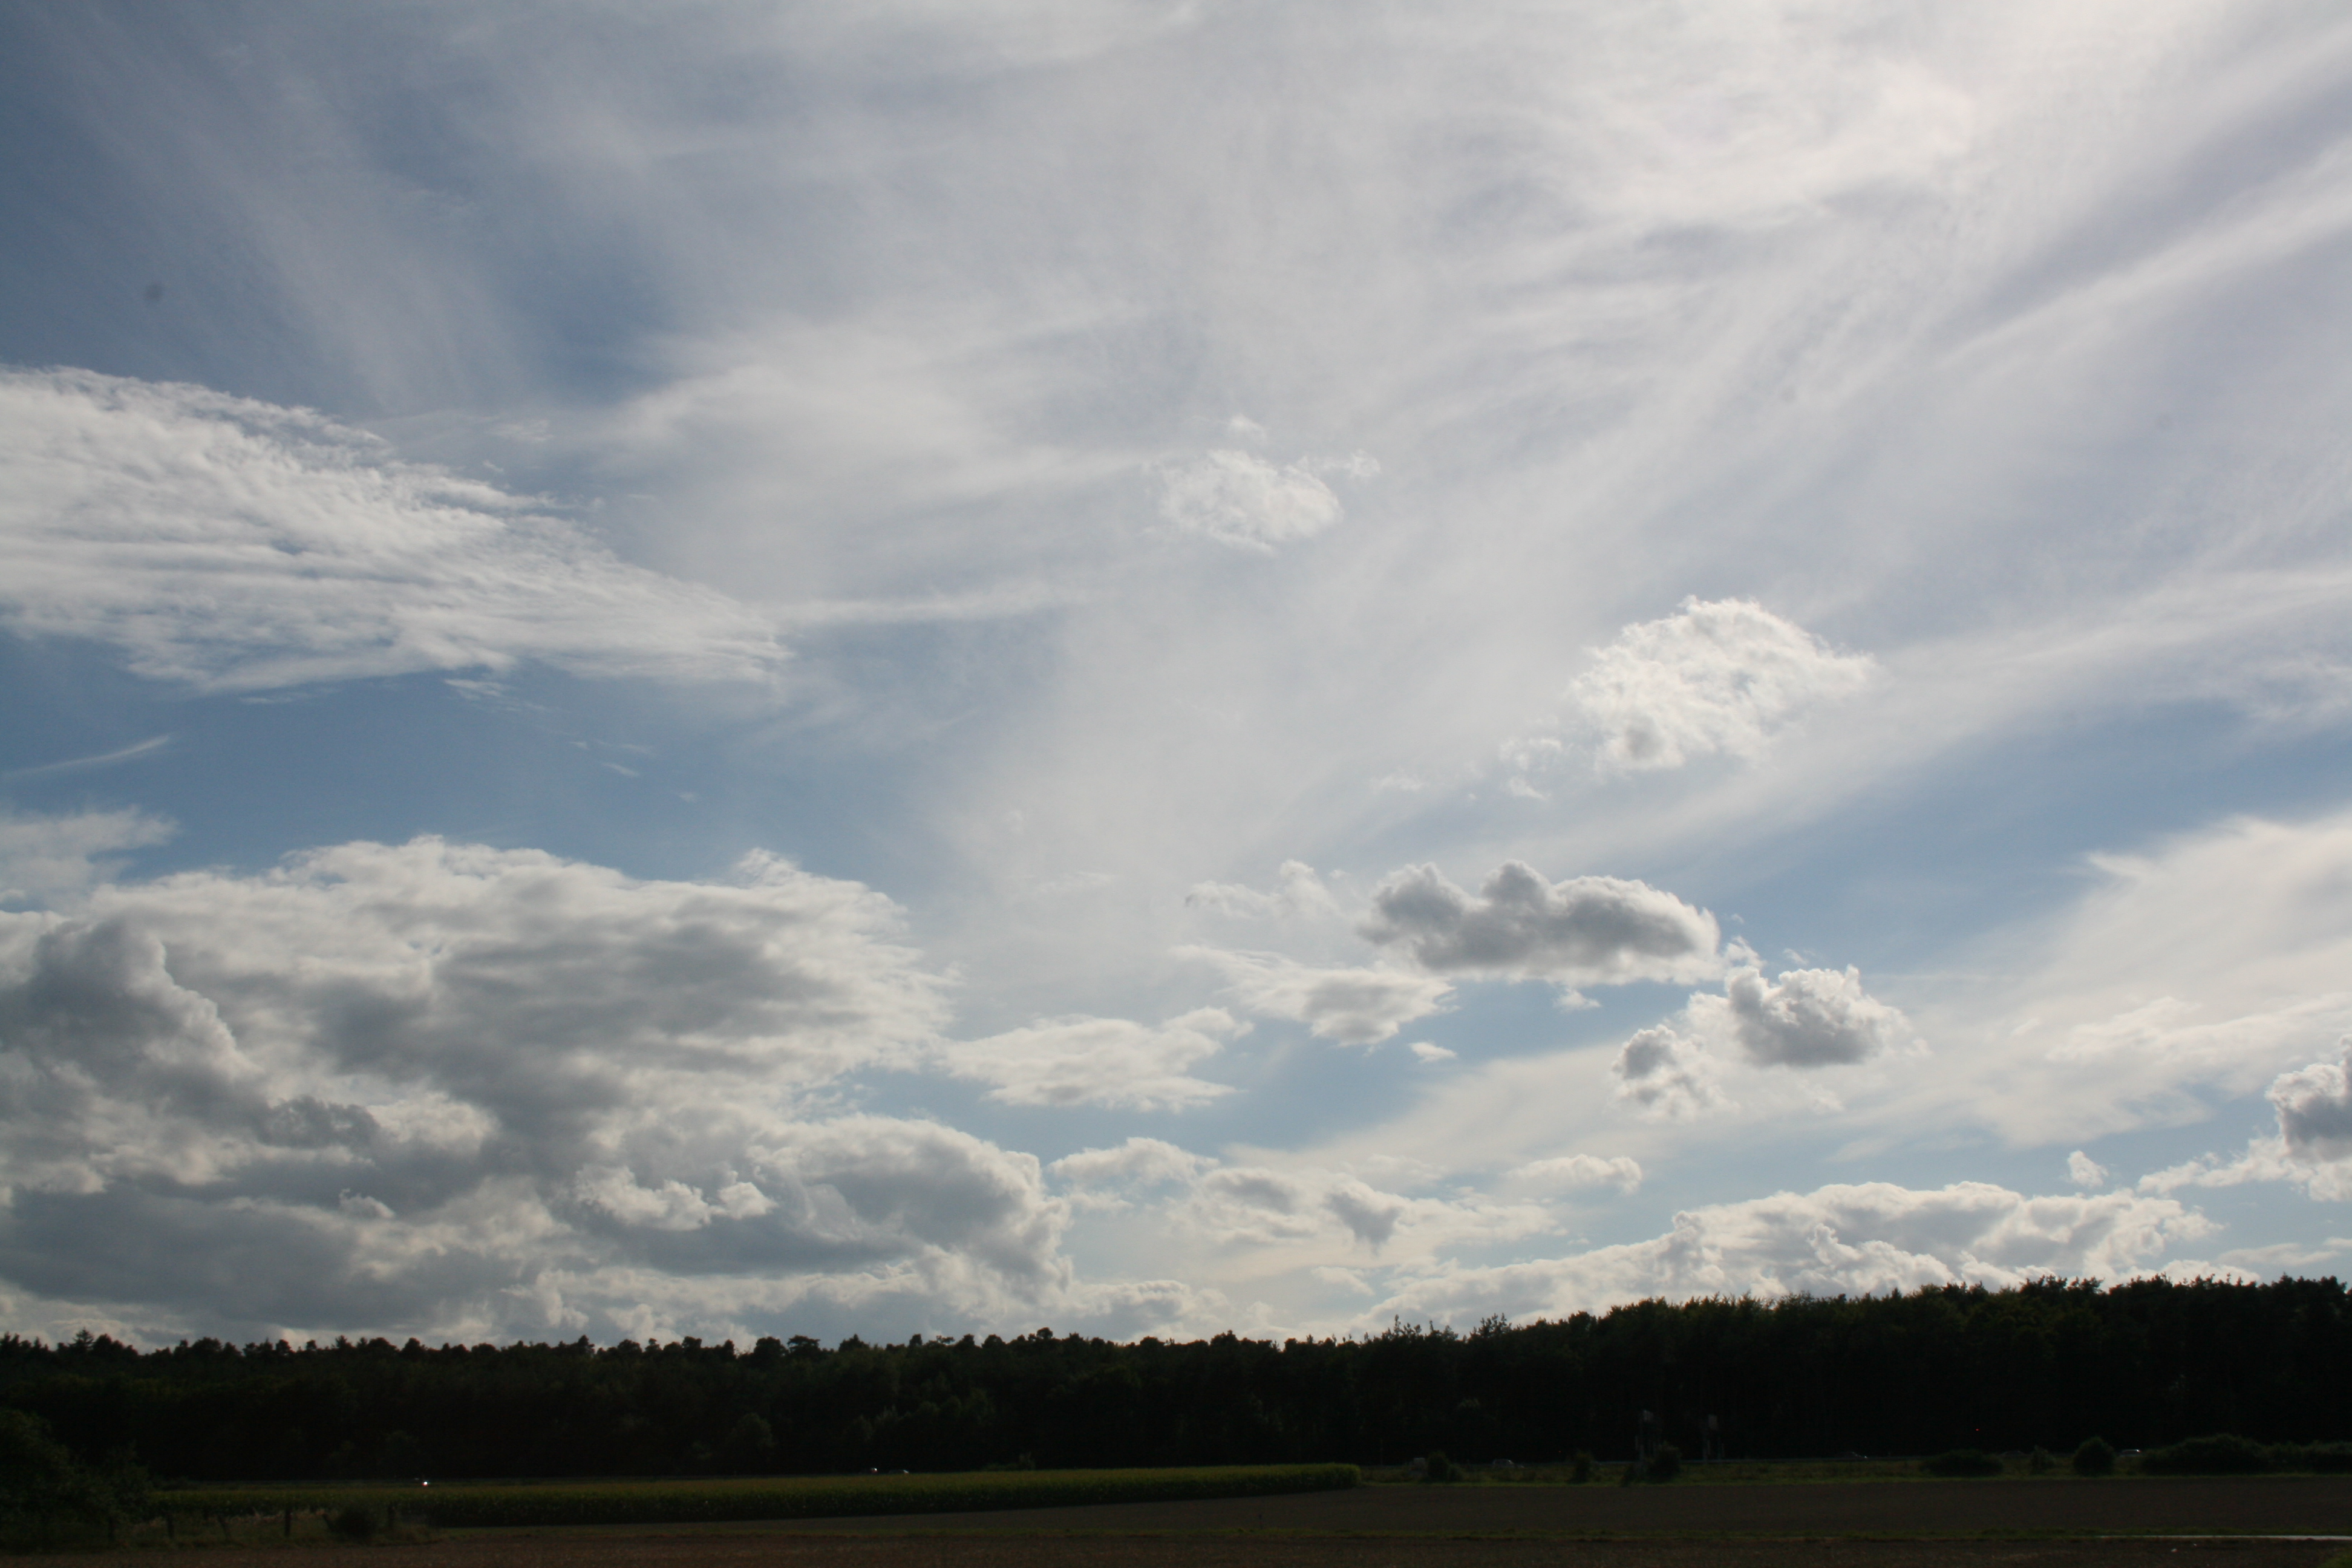 |
d) 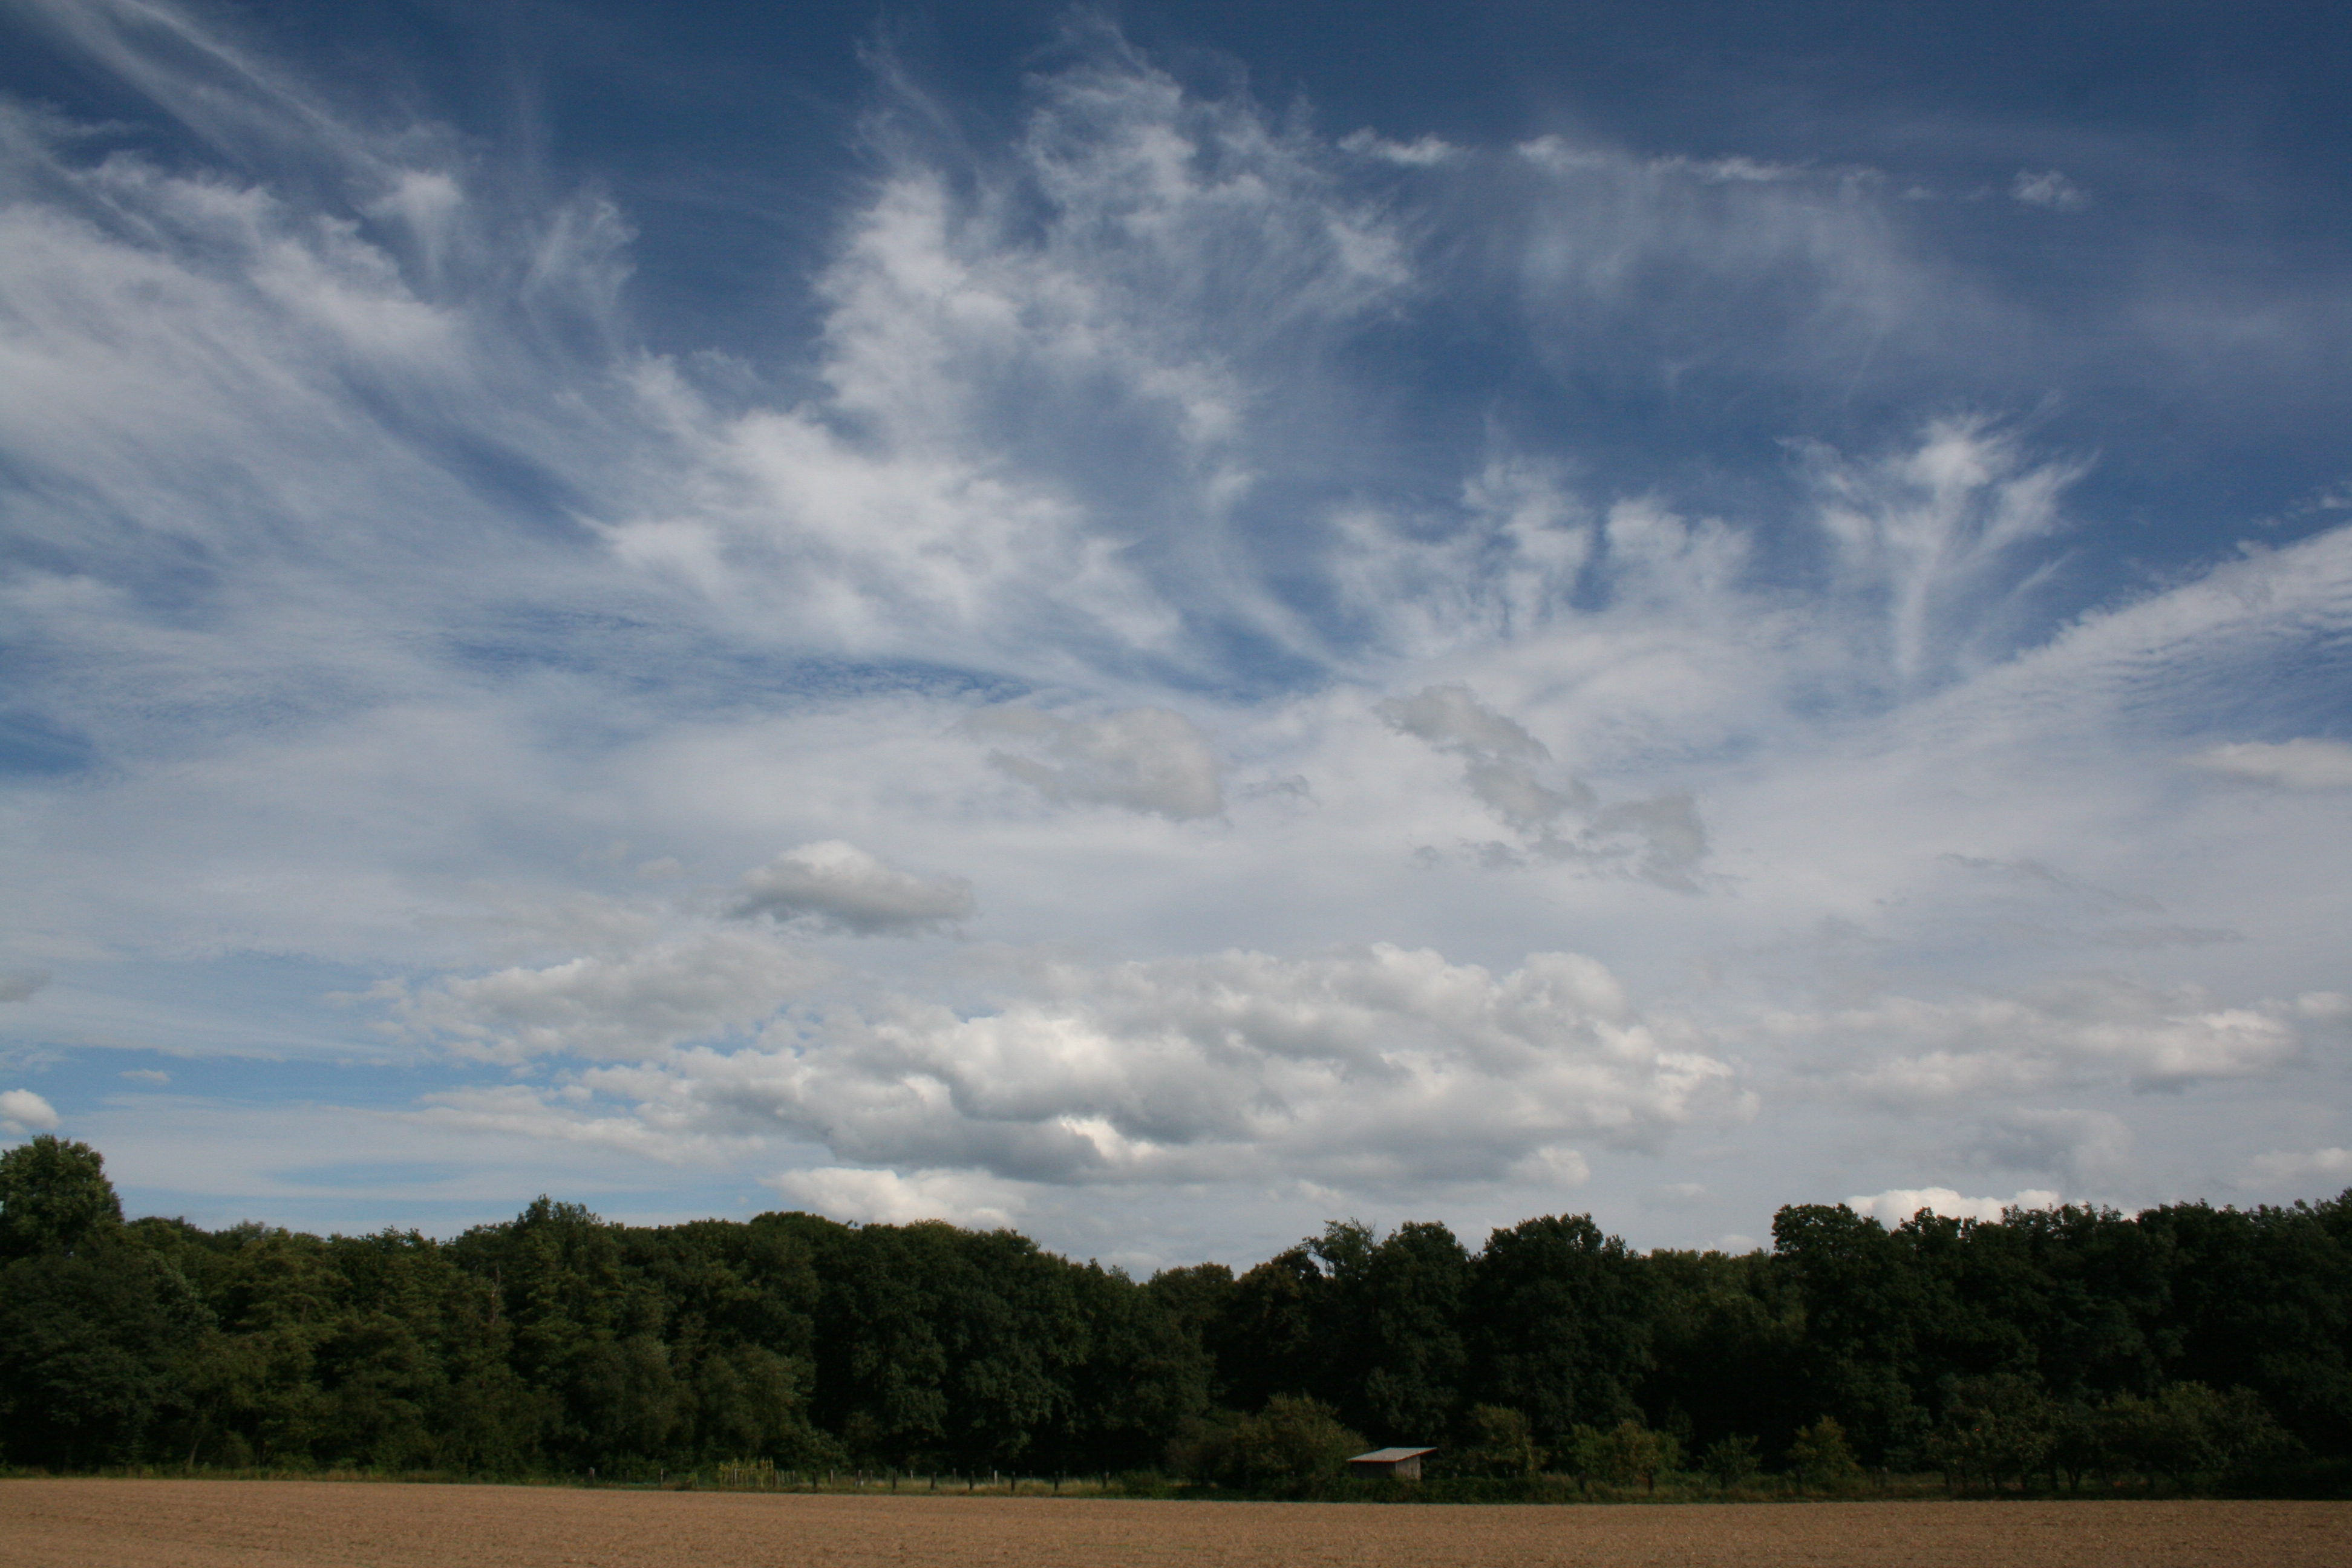 |
Fig. 1.1 a-d: 25th Aug 2012 at 14 UTC, Turbulence impressions in the near of Frankfurt/Main [Peter Schmitt]
Question
In what cloud level you will suppose the highest risk for turbulence?
The correct answer is "high level".
This was a turbulent weather situation with turbulence in all cloud levels. The form of the high cirrus clouds gives a strong hint for high wind shear and also a high risk for turbulence.
If you are taking your first steps as a forecaster, it is good training to compare your visual impression with the different satellite images. Observing clouds in different places from SYNOP reports and satellite images is good for practice. In the next step, you can add the information from radio soundings. After that, the summary of the in situ and remote sensing measurements provide a lot of information:
- the microphysics of the clouds
- the development of the clouds
- the risk of icing
- the risk of turbulence
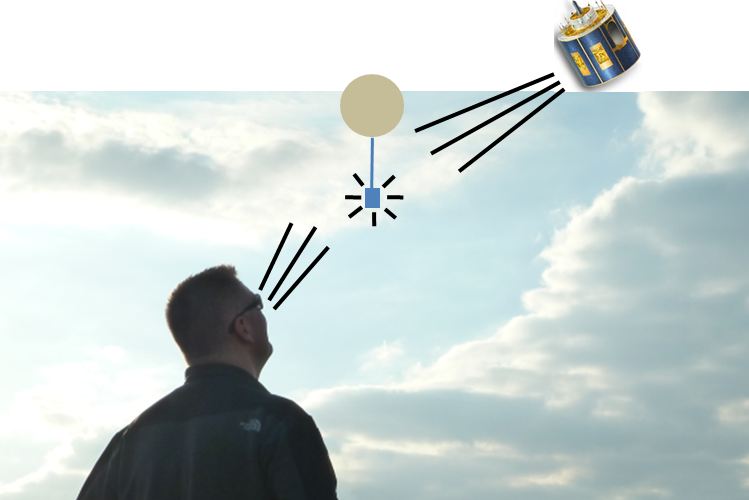
Fig. 1.2: 25 Aug 2012 at 14 UTC, Cloud detection with different instruments[DWD]
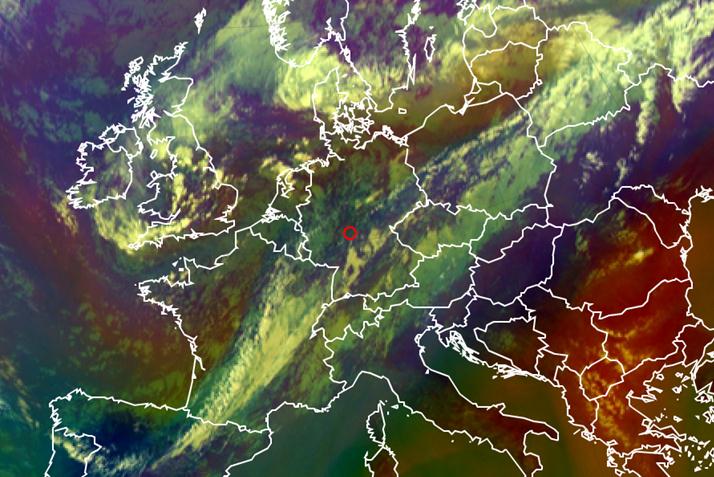
Fig. 1.3: 25 Aug 2012 at 12 UTC, Airmass RGB. The red circle shows the location of Frankfurt/Main [DWD]
Question
Do you see a source of turbulence in the associated Airmass RGB (Fig. 1.3)?
The correct answer is c).
You can see the jet axis in the cloud structure and the color changing from bluish to greenish. You will learn more about these indicators of turbulence in this module.
In the next image, you see a section of the forecast SWC at 18 UTC for Europe. The forecast shows a jet stream above Frankfurt/M. with a maximum wind speed of 120 knots and a CAT area with moderate turbulence between FL290 and FL400.
This jet was the reason for the intensive wind shear seen in the images taken from the ground. Due to the time difference between the satellite image and the SWC chart, the jet axis lies more to the northwest at 12 UTC.
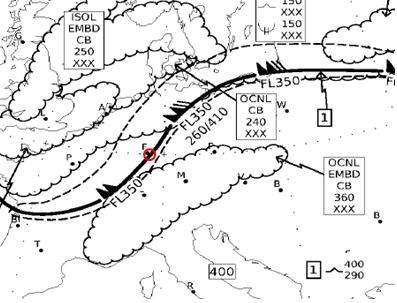
Fig. 1.4: 25 August 2012, Significant Weather Chart SWC (section) for 18 UTC, with the location Frankfurt/Main from the WAFC London