Chapter II: What is Clear Air Turbulence (CAT)?
Table of Contents
Definition of clear air turbulence
Clear air turbulence is the term for medium- or high-level turbulence in regions with significant wind shear. Turbulent areas of this kind are mostly free of clouds. However, sometimes you can find cloud formations (mostly ice clouds) that are typical for turbulent areas, or a higher concentration of water vapor in the vicinity of CAT. Both of these hint strongly at the presence of CAT.
Often the designation "High Level Turbulence (HLT)" would be better than CAT, as it also includes the cloudy areas. However, in aeronautical meteorology and aviation, the term CAT is more common. This is why we shall use CAT in this module.
Figure 2.1. shows the four forces affecting an aircraft:
- Thrust
- Resistibility
- Lift
- Weight
When the aircraft is flying with a constant speed and a constant height, all fources are in balance. The amount of lift and weight are equal. The same applies to trust and resistibility. The lift force is a function from the tip velocity of the air (v2) and the air density (ρ).
This means that CAT can occur by the flight through a border of different air masses with significantly different densities. For instance where there is a temperature gradient and especially at the tropopause. A strong relationship exists between variations of wind speed from inflowing air and the CAT (wind speed with the square of 2).
Bigger airplanes have a greater wing spread and mass. Their vertical movements are less extreme than in smaller airplanes due to inertia. On the other hand, in bigger airplanes the structure is more loaded. In extreme cases of CAT the structure could be damaged or break up.
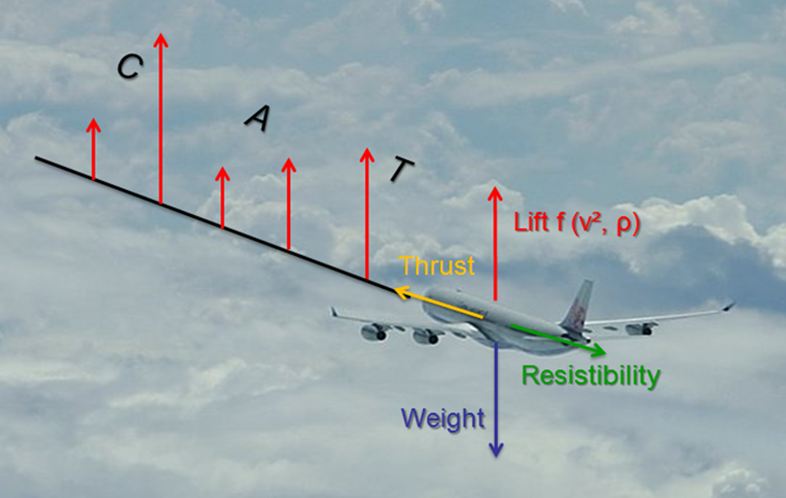
Fig. 2.1: Forces affecting an aircraft
Clear air turbulence as an aviation hazard
Besides icing and poor visibility, turbulence is one of the most common cause of weather-related aircraft accidents
The risk for CAT is high
- during the cruise phase of flight in high altitudes, in the vicinity of a jet stream
- over high mountains if the wind speed is high
- above and near cumulonimbus clouds
Examples can be found in chapter III.
Types and severity of clear air turbulence
What makes CAT so dangerous is that it appears very suddenly. Slight turbulence can cause discomfort for passengers, or even injuries if they do not fasten their seat belts. Extreme CAT can inflict structural damage on the airplane.
The following table outlines the connection between the severity of CAT and its consequences for both the aircraft and the people inside it.
| Intensity | Aircraft reaction | Reaction inside aircraft |
| Light not shown in sign. Weather Charts |
Turbulence that causes slight changes in altitude and/or attitude (pich, roll, yaw). IAS (Indicated Air Speed) fluctuates 5 15 kt < 0.5g at the aircraft's centre of gravity |
Occupants may feel a slight strain against seat belts or shoulder straps. Unsecured objects may be displaced slightly. Food service may be conducted and little or no difficulty is encountered when walking. |
Moderate  |
Turbulence with a greater intensity as light Turbulence. Changes in altitude and/or attitude, but the aircraft remains in positive control all times. IAS fluctuates 15 25 kt 0.5 -1.0g at the aircraft's centre of gravity |
Occupants feel definite strain against seat belts or shoulder straps.
Unsecured object are dislodged. Food service and walking are difficult. |
Severe  |
Turbulence that causes large, abrupt changes in altitude and/or attitude.
Aircraft may be momentarily out of control.
IAS fluctuates more as 25 kt. > 1.0g at the aircraft's centre of gravity |
Occupants are forced violently against seat belts or shoulder straps.
Unsecured objects are tossed about. Food service and walking are impossible. |
Table 2.2: Intensity levels of CAT
Example for the effects of severe clear air turbulence:
On 28 December 1997, a Boeing 747-100 was flying from Narita International Airport in Japan to Honolulu International Airport in Hawaii. After two hours of flight, at an altitude of 9400 meters, the plane received reports of severe CAT in this area and the seat belt sign was turned on. Moments later, the aircraft suddenly dropped around 30 meters, seriously injuring many passengers, although there was no damage to the aircraft. The plane turned around and landed safely back in Tokyo, but was not put back in service since it had been scheduled to be retired in early 1998. One passenger died of her injuries after landing in Tokyo.
Summary:
+1.8g dropped to -0.8g
+/- 30 m (100 ft) change in altitude
15 kt horizontal wind shear
1 fatality and 74 injuries
The significance of jet streams for clear air turbulence
Jet streams are intense, relatively narrow, quasi-horizontal currents of wind that are accompanied by strong vertical wind shear. They are found at or near the tropopause. By definition, the wind speed is at least 30 m/s or 60 kt in a jet stream.
There is a strong relationship between the jet stream and the clear air turbulence. CAT is caused by the vertical and horizontal wind shear of jet streams. CAT is strongest on the cold side of the jet, next to and just underneath the axis of the jet.

Fig. 2.3: Polar front Jet at 300 hPa combined with isotachs 60 kt [DWD]
Figure 2.3 shows the geopotential at 300 hPa as narrow black isolines, the isotachs (in knots) of the jet as dashed isolines, the jet axis as a brownish line, and surface fronts.
There is a strong polar jet with a length of 8000 km and a width of 1000 1500 km.
The maximum of the wind velocity (jet streak or jet core) lies over southern Scandinavia
and has a maximum velocity of 180 kt.
The strongest horizontal wind shear and highest risk of CAT is found to the north
of the jet axis.
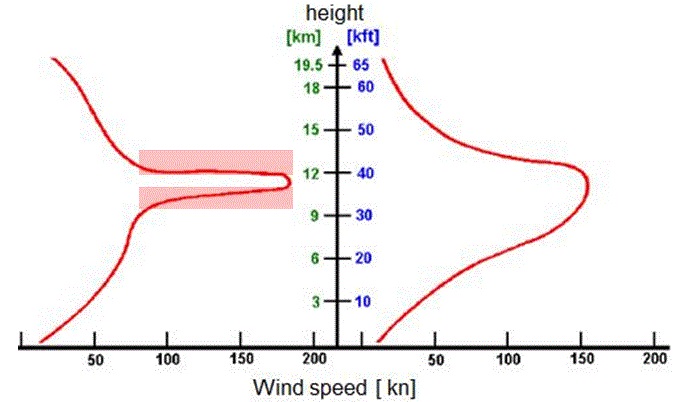
Fig. 2.4: The profile on the left represents a jet with strong vertical wind shear and a high risk for clear air turbulence above and below the jet core (red area). Wind shear and the risk of CAT are smaller for the profile on the right. [DWD]
The following animation 2.5 shows a winding polar jet stream. Wind velocity within the polar jet stream can exceed 300 kt. Here, the highest wind velocity is colored red; slower winds are blue.
Animation 2.5: Meandering polar front jet stream [NASA]
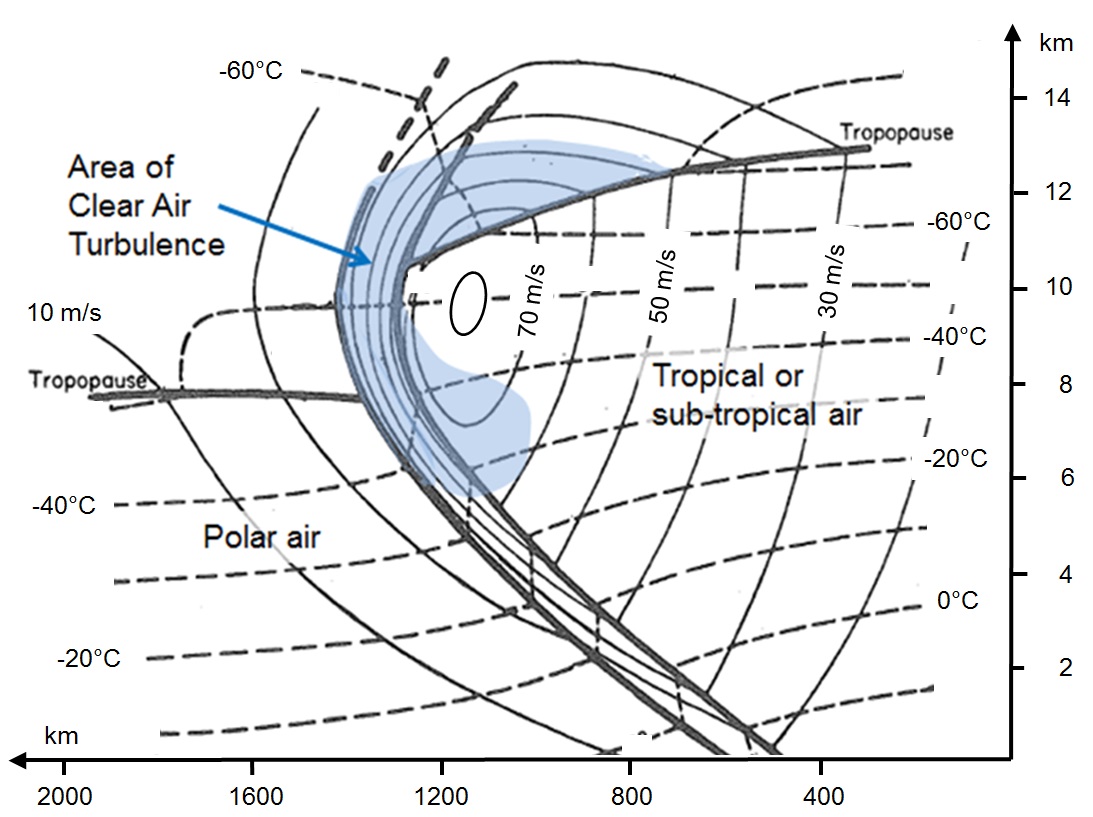
Fig. 2.6 Vertical cross section of a polar jet stream, showing the mid-latitude/sub-tropical and polar air, tropopause, isotachs (solid line, in m/s) and isotherms (dashed line, in degrees Celsius).
In Fig. 2.6 you can see with the blue areas that CAT is strongest on the cold side of, above and underneath the jet core. In this area we have a combination of a strong gradient of isotachs and high wind velocity.
On the cyclonic side of the jet axis you will find a lower tropopause with sinking dry air which could be of stratospheric origin. The border of the high cirrus clouds in the warm airmass and the lower clouds in the cold airmass will be a good indicator for the jet axis. You will find more examples in chapter III.