Jet fibres in a case from 1 March 2008
On 1 March 2008 the synoptic situation was characterized by a rapid cyclogenesis over the Atlantic. At 15 UTC, a line of convective clouds reached the north of Italy. A jet stream with a maximum of 180 kt extended from Scotland to western Germany.
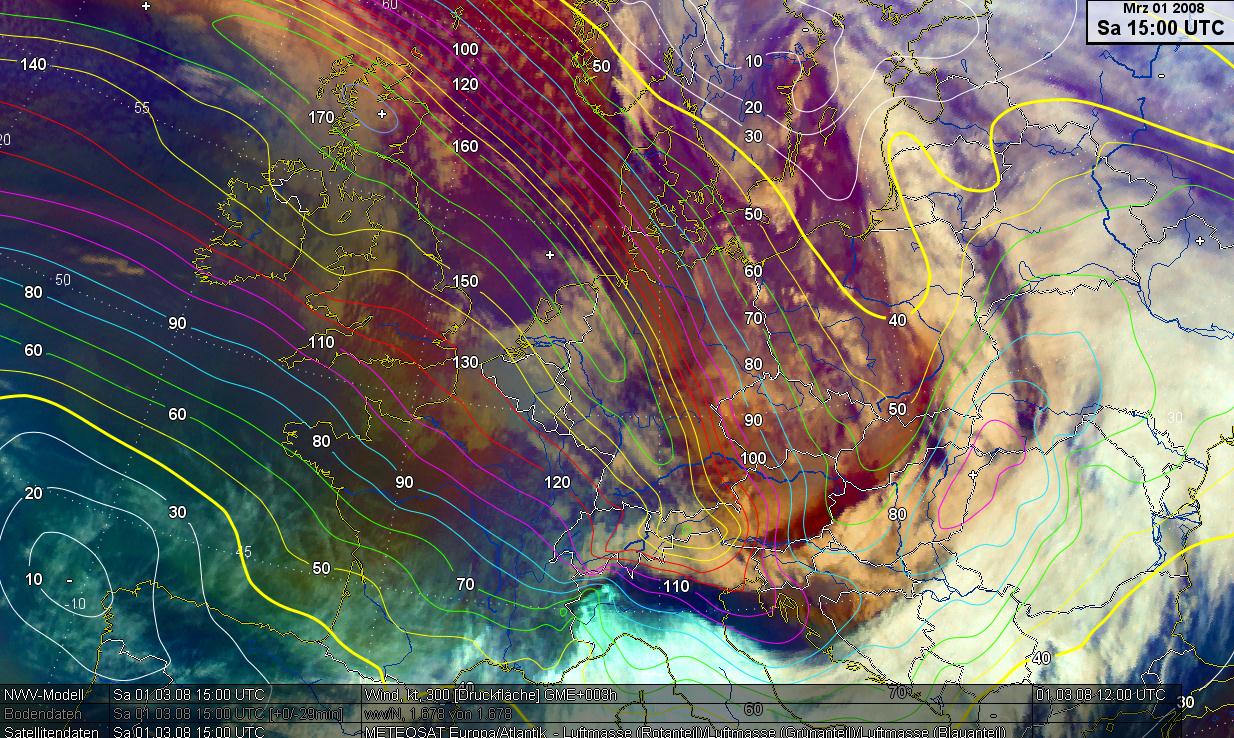
Fig. 3.4: 1 March 2008, 15:00 UTC. 300 hPa isotachs in kt, Airmass RGB
The images in Fig. 3.5 3.8 show sections of 15 UTC RGB's over Germany. There are jet fibres parallel to the jet axis. The white color in the Airmass RGB hints at high clouds. The HRV RGB and the HRV shows clearly the shadows of lower clouds over eastern parts of Germany.
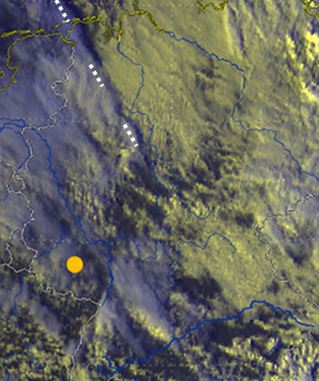
Fig. 3.5: HRV RGB [DWD] |
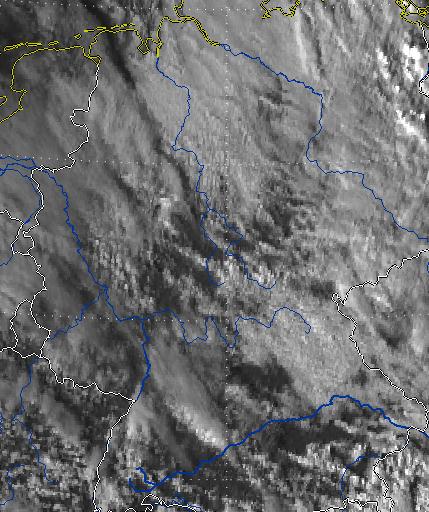 Fig. 3.6: HRV Fig. 3.6: HRV |
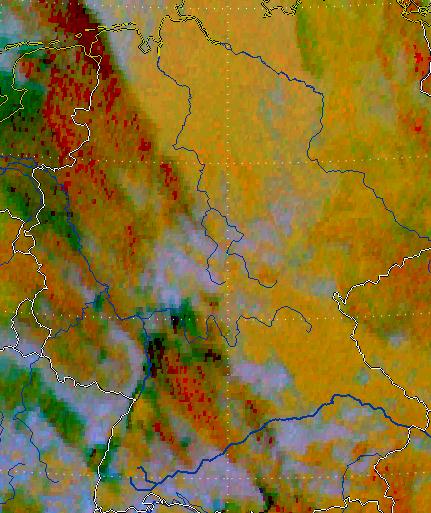
Fig. 3.7: Dust RGB [DWD] |
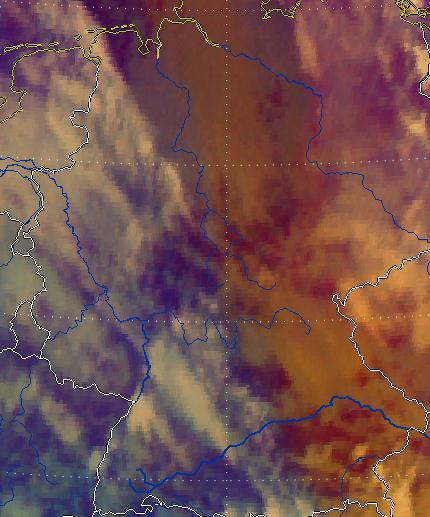 Fig. 3.5: Airmass RGB [DWD] Fig. 3.5: Airmass RGB [DWD] |
| (Fig. 3.5 3.8: 1 March 2008, 15:00 UTC [DWD]) |
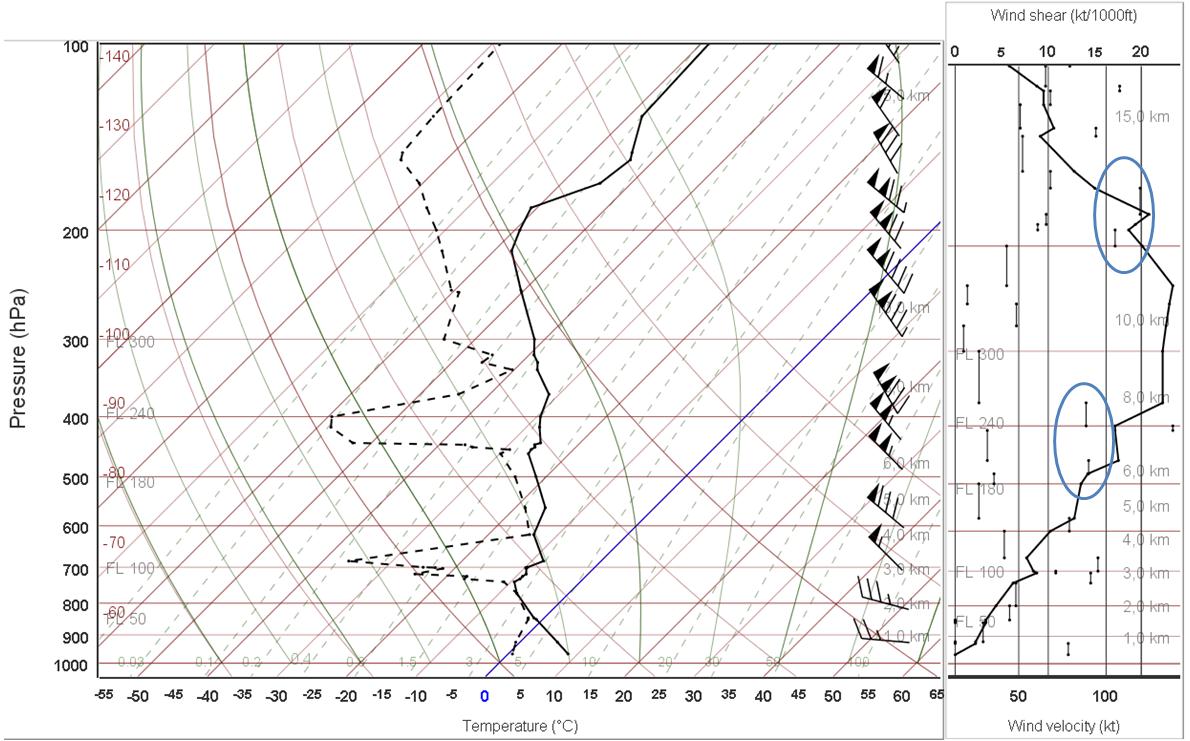
Fig. 3.9: Radiosonde Idar Oberstein, 1 March 2008, 18:00 UTC
Sounding on the left, wind velocity (kt) and shear (kt/1000 ft) on the right [DWD]
The radiosonde in Idar Oberstein (western Germany, yellow dot in the HRV-RGB) measured a maximum wind speed of 140 kt at a height of 10 km. Vertical wind shear in the jet core is around 15-20 kt/1000 ft.
You can use the vertical windshear for a useful empirical prediction of CAT.
If the vertical windshear is
≥ 6 kt/1000 ft, it is a hint for moderate CAT
≥ 9 kt/1000 ft, it is a hint for severe CAT
In this case, there is potential for severe CAT under and above the jet core (see the oval form).