Clear air turbulence behind a split cold front
For the 1 March 2008 case
The convective line of a split front moved southeast quickly. The corresponding images at 300 hPa reveal the convective line in the left exit region of the jet over central Europe. The convective line is just east of the trough's axis and southeast of the approaching PV-maximum at the level of potential temperature 310 K. The intense weather situation can be seen from the lightning detection chart (12942 strokes of lightnings within one hour, wind velocity of the lightning line about 100 km/h).
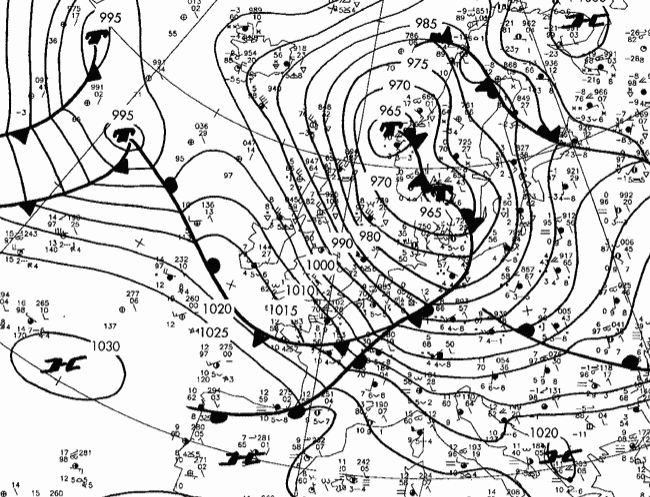
Fig. 3.10: Surface pressure, synop-observations and surface fronts, 1 March 2008, 06:00 UTC [DWD]
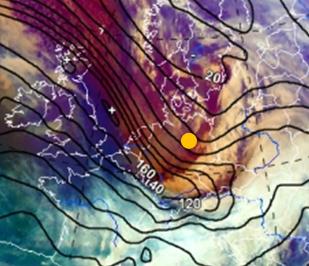
Fig. 3.11: Airmass RGB and Isotachs 300 hPa |
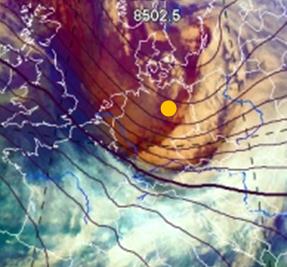 Fig. 3.12 Airmass RGB and Isohyps |
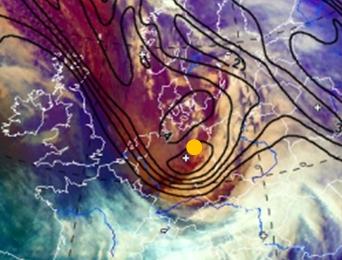
Fig. 3.13: IPV 310 K and Airmass RGB |
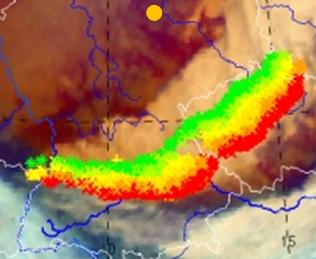 Fig. 3.14: Lightnings during last hour |
| (Fig. 3.11 3.14: 1 March 2008, 0900 UTC) |
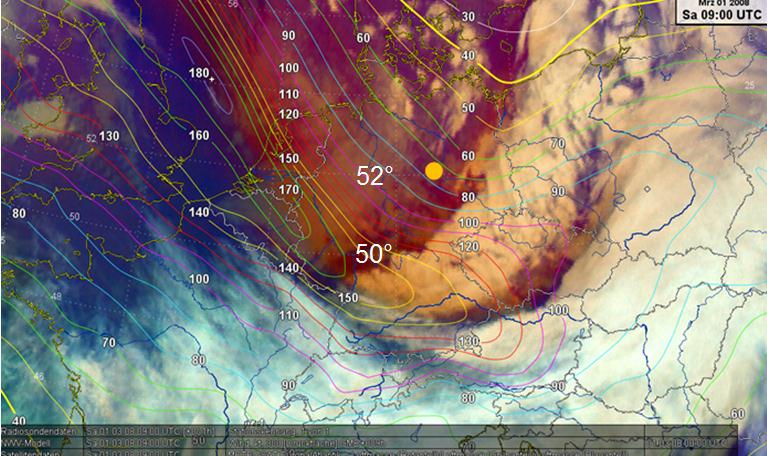
Fig. 3.15: 1 March 2008, 09:00 UTC, Airmass RGB, isotachs 300 hPa [DWD]
Question
You can use horizontal wind shear data to make a forecast of CAT for the area around Magdeburg.
If the horizontal windshear is
≥ 20 kt/deg of latitude, it is a sign of moderate CAT
≥ 30 kt/deg of latitude, it is a sign of severe CAT
Based on horizontal wind shear alone, would you expect severe CAT (see Fig. 3.15)?
The correct answer is a).
In the area of Magdeburg we only have a shear of 20 kt/one degree latitude (ca. 110 km).
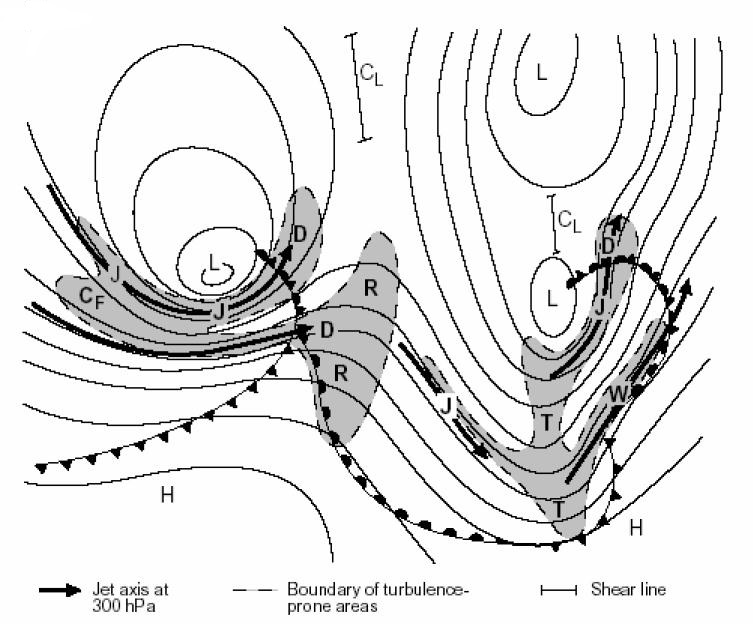
Fig. 3.16: Schematic showing analysis of 300 hPa geopotential and areas prone to CAT [WMO Aviation Hazards]
Question
In Fig. 3.16 you see an analyzed weather chart, with areas prone to CAT colored gray.
Which potential CAT areas in Fig. 3.16 do you find in the situation of Magdeburg (yellow dot in Fig. 3.11 3.15)?
The correct answer is b).
Explanations:
· T: This is not a really sharp upper trough.
· D: This is correct. There is wind shear in the diffluent exit region of the jet.
· J: This area is on the low pressure side of the jet, but there is no wind shear just inside the jet streak.
Until now, we have two signals for CAT in the area of Magdeburg.
The conceptual model of a split cold front can also indicate the presence of CAT. Behind the line of convective clouds there is a high risk of CAT due to
- descending dry air causing potential instability
- a transition zone from ascending to descending air
- the rapid movement of the front
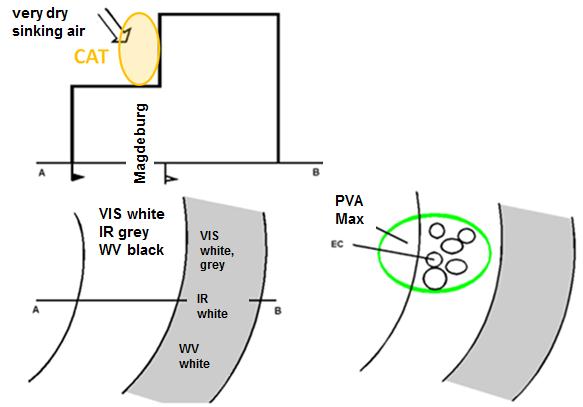
Fig. 3.17: Conceptual model of a split front
See the Manual of Synoptic Satellite Meteorology (SatManu) for more details Split Front.