
Identify surface features
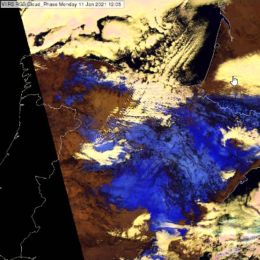
Pia Isolahtenmaki (stepping in for Robert Makitie) presents how FCI proxy data help in differentiating cloud types in low-cloud conditions.
On the 11th of September an almost stationary frontal system occurred over southern Finland leading to development of a large fog cloud over the Gulf of Finland and the Baltic Sea. The fog later moved slowly over southern Finland, where Finland’s busiest airport, Helsinki-Vantaa airport, is located. The fog cloud that occurred over the Gulf of Finland was hard to spot from SEVIRI images due to different layers of middle and high clouds. When thinking about the future, the question arises, would the FCI have spotted something more in this situation?
Signe Aaboe presents the data and software that OSI SAF offers to users.
Ocean and Sea Ice Satellite Application Facility (OSI SAF) was initialised in 1997 and is one of eight EUMETSAT Satellite Application Facilities, which provide users with operational data and software products from meteorological satellites.
The OSI SAF programme has a focus on the ocean-atmosphere interface and derives ocean products of wind, temperature, radiative fluxes and several perspectives of the sea ice. This presentation will give an introduction to OSI SAF, - what it is, who is involved, and which products are derived. The main focus will be on sea-ice developments and products.
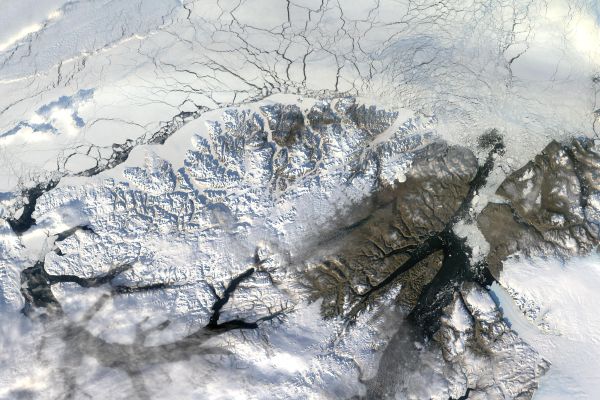
Jari Haapala explains how thermodinamical and dynamical factors affect the arctic sea ice characteristics.
The mass balance of the Arctic Sea ice depends on thermodynamical and dynamical factors. Thermodynamical and mechanical sea ice state variables are strongly coupled, but the strength of coupling varies in daily, seasonal, and climate time scales. When the ice pack is thick, solid, and compact, this coupling is strong and large areas of pack ice are mechanically connected. In these circumstances, the internal stress of pack ice accumulates and reduces differences in ice motion. In these conditions drift speed of the Arctic Sea decreases, the age of ice increases and the total mass of the ice pack increases. On the contrary, a thinner ice pack which includes cracks, leads, or larger open water areas is in turn mechanically weakly connected, exhibits larger variations in motions in shorter time and length scales drifts with higher speed, and exhibits shorter residence time in the Arctic. In this talk, the importance of ice dynamics on sea ice mass balance is reviewed and new findings based on the MOSAiC campaign are discussed.
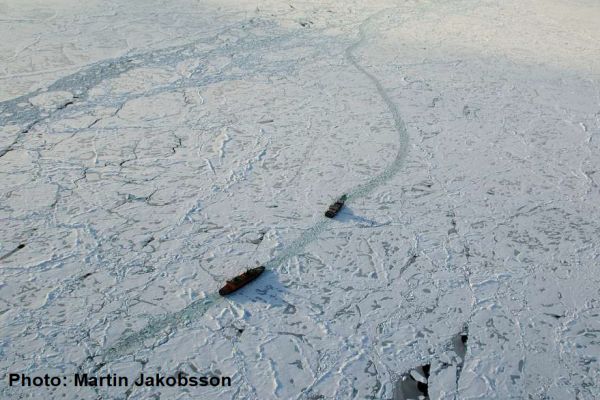
Patrick Eriksson speaks about monitoring sea ice in the very heavily trafficked Baltic Sea
The Baltic Sea, a relatively small semi-closed basin with brackish water, is one of the most heavily trafficked sea areas in the world. Thousands of vessels visit ice-infested ports every winter, which requires well organized icebreaking. To support this winter navigation operation, the Ice Service at FMI conducts monitoring and forecasting of the sea ice throughout the winter. An essential source of information is obviously satellite data. Imagery from several satellite platforms is not only processed to serve ice charting and reporting, but is also delivered in near-real-time straight to the bridges of the icebreakers. The dark and cloudy Nordic winter has proven the Synthetic Aperture Radar instruments (SAR) to be the most suitable when analysing the development of the sea ice. Different passive instruments are also used, light and cloudiness permitting. All satellite platforms bring their various strengths and limitations on the ice analyst’s desktop, causing constantly changing challenges to the charting of sea-ice features. So far, the analysis has been predominantly manual work, but the ever-increasing data volumes are setting a demand for AI-based automatic interpretation.
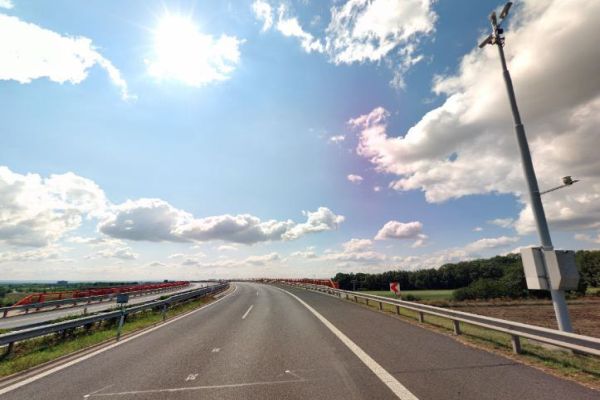
Vojtěch Bližňák presents how the satellite cloud data helps forecasting road surface temperature in Czechia.
The goal of the contribution is to assess an impact of extrapolated cloud cover derived from satellite observations on forecasts of road surface temperature (RST) performed by the road weather model (RWM) FORTE. Based on road weather station measurements and forecasts of the ALADIN numerical weather prediction (NWP) model, which are used as inputs to prepare initial and boundary conditions, the RWM generates a linearly continuous forecast of RST on selected Czech highways. The work will compare the evaluation of RST forecasts generated by two model runs using NWP and satellite-derived cloud cover estimation.
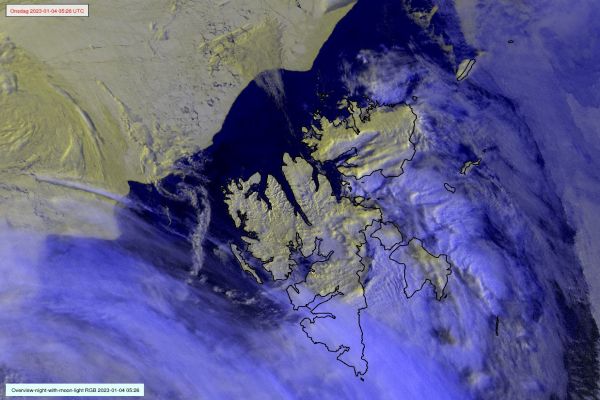
Vesa Nietosvaara showcases how the MTG's FCI instrument will improve the quality of satellite data, especially for users in high latitudes.
The first Meteosat Third Generation (MTG-I) satellite with Flexible Combined Instrument (FCI) was launched at the end of 2022. It will be followed later in 2024 by MTG-S Satellite with Infrared Sounder onboard. MTG will carry novelty instruments – Infrared Sounder, Lightning Imager and Ultraviolet Visible Near-infrared (UVN) Spectrometer - in the GEO orbit. Meteosat Third Generation aims to secure continuity and to increase the capabilities of the Meteosat satellites in response to requirements of the future forecast/nowcast systems. Altogether, the new and enhanced capabilities will allow us to make a huge step in better monitoring of our environment, and allowing development of new applications.
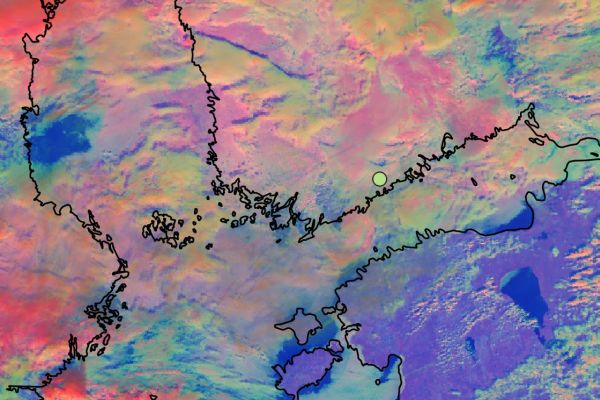
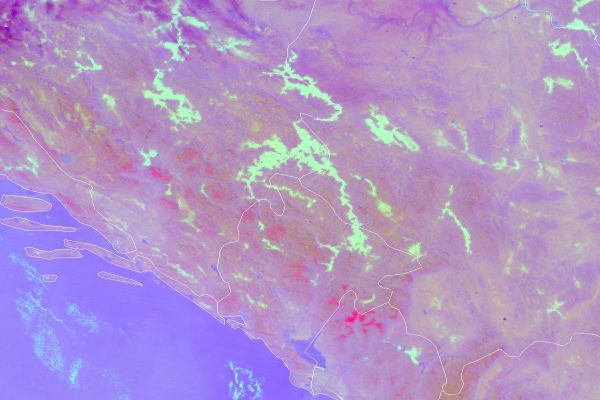
This case study treats snow detection with the Cloud Phase RGB.
During 07-10 January 2021, a winter storm produced a significant 30-50 cm snow depth over large parts of Spain. We studied this snow cover over the following ten days in VIIRS Cloud Phase RGB images. The Cloud Phase RGB is a composite image, which will also be available with data from the future Meteosat Third Generation (MTG) imager.
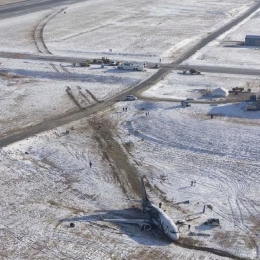
Roland Winkler talks about the safety and economic impact of wind in aviation.
Despite ever-advancing technology and automation, weather continues to have a major impact on aviation. Weather forecasts in aviation have two important functions. They support safety on the one hand and economic efficiency on the other. As part of this presentation, I would like to take a closer look at the complex subject area that the wind exerts on the approach and departure.
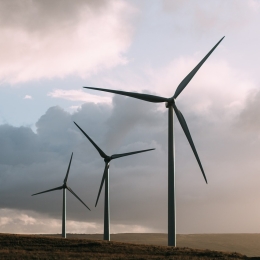
Irene Schicker taks about wind forecasts needed to efficiently operate wind turbines.
With the increase in wind energy production being fed into the power grid accurate high frequency predictions of the estimate d power for the next hours and days ahead are needed to schedule feed-in rates and secure power grid stability. To achieve this a combination of different kinds of information and data sets are needed. Here, statistical and machine learning methods proved to be a suitable tool. However, a thorough selection of input data is needed as well as considering extreme events (upper and lower tails) in model training and avoiding smoothed forecasts.
A brief introduction into post-processing for wind energy applications using statistics and machine learning, including useful tools/methods/data, will be given.
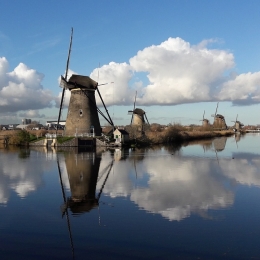
Sabine Zerobin recaps the steps necessary to plan, construct and operate wind turbines.
A reliable wind measurement is the basis for the successful accomplishment of wind power projects and the profitable operation of wind farms. Therefore, the current presentation gives an overview about the steps that are necessary to develop a wind power project from the green field, starting with a well-defined measurement campaign. Besides constraints originating from the conditions on site, pros and cons of different measurement techniques as well as the corresponding technical standards have to be kept in mind.
Reaching the measurement target therefore means, that sufficient data in a good quality is available to be used for further evaluations andassessments of the regarded site, which are then used to determine whether a project can be realised in terms of profit as we ll as from the technical point of view.
Even after a successful realisation of a project, wind measurements still play an important role, especially when it comes to the verification of the plant performance.
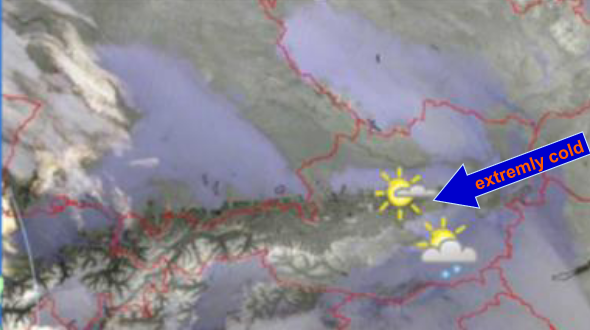
Gernot Zenkl presents the types of meteorological situation that can lead to critical avalanche situations in the eastern Alps.
Length: 45 minutes.
In this presentation one could see a short overview of the interesting and challenging work as an avalanche forecaster. Gernot Zenkl has shown which types of meteorological situation can lead to critical avalanche situations in the eastern Alps. Furthermore he explained the methods we use to inform and warn the people.
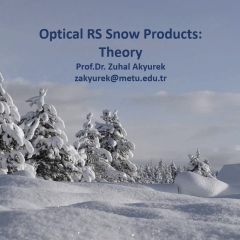
Zuhal Akyurek reports on snow reflectance characteristics that have to be considered in snow detection from satellite data.
Snow on the ground differs from most of the Earth surfaces by its high reflectance or albedo in the visible and near-infrared wavelengths (0.350 to 1 μm). For longer, the snow’s reflectance decreases significantly. In these wavelengths,snow is even less reflective than certain types of vegetation. Most of the incident radiation in these wavelengths is absorbed in the snowpack. These unique spectral characteristics are used in optical remote sensing to distinguish between snow and other types of surfaces. The numerous validation studies indicate that the satellite snow products have large snow mapping accuracy with respect to ground snow observations for cloud-free conditions, which varies between 69 and 94% in the winter seasons. The main limitation of existing optical platforms operating at a daily timescale is cloud coverage, which significantly reduces the availability of snow cover information.
In this session, algorithms used to retrieve HSAF snow products; snow mask (H31, H34) and effective snow cover area (H32, H35) from opticalsatellite data are presented. The challenges and the opportunities in retrieving snow cover mapsfrom optical data are discussed.