
Identify and interpret fields and derived products
David Fairbairn discusses the theory behind the near-real-time and data record RZSM products.
Length: 25 minutes.
ECMWF provides the core root-zone soil moisture (SM) products for H SAF through an Extended Kalman filter assimilation system, running independently of the NWP system. Space borne scatterometer-derived surface SM observations are assimilated into the root-zone (0-1 m) SM of the H-TESSEL land surface model. In this presentation, the theory behind the near-real-time and data record products is discussed.
The presenters show examples for the use of SM data in identifying drought conditions in some regions worldwide.
Length: 25+14 minutes.
Satellite soil moisture (SM) products are highly suitable for monitoring agricultural drought. As satellite SM products cover long time periods and are available for large regions, the spatial and temporal analysis of drought conditions can be performed. The presentation will describe the theoretical background for performing drought analysis with satellite SM data, and will show some examples for the actual use of the data in identifying drought conditions in some regions worldwide.
Simone Gabellani and Fabio Delogu describe how soil moisture estimated trough satellite can be compared and validated with other sources of information.
Length: 38+39 minutes.
Soil Moisture is a crucial variable in hydrological applications. It can be measured and estimates in different way and along different spatial and temporal scale. The presentation describes how soil moisture estimated trough satellite can be compared and validated with other sources of information; theoretical basis and practical example will be showed.
Stefania Camica and Lucca Brocca describe the theoretical background for using satellite SM products in flood prediction.
Length: 19+24 minutes.
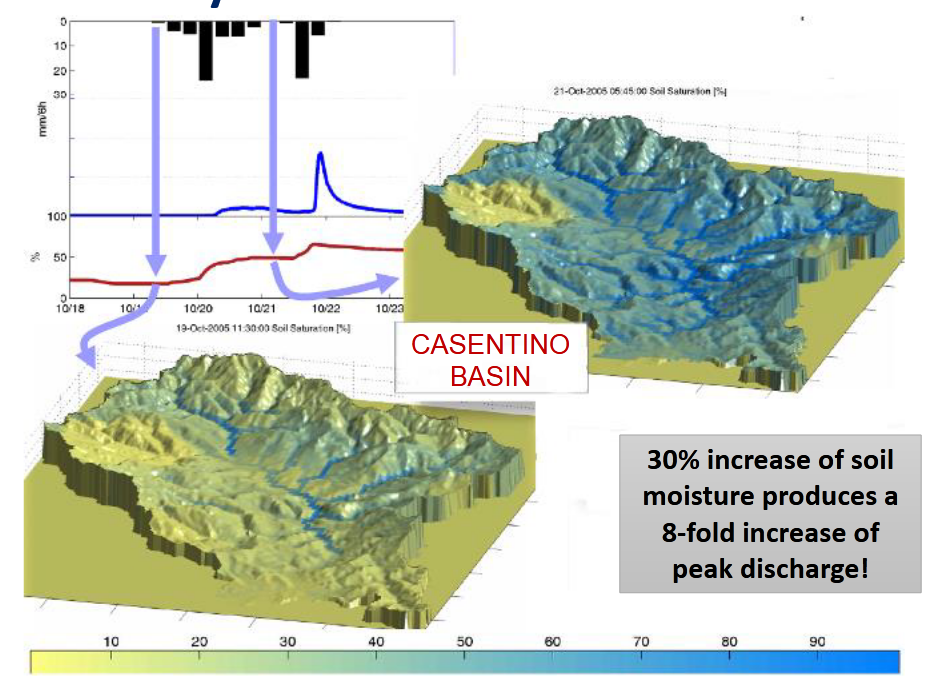
Satellite soil moisture (SM) products have been largely used for flood prediction. The knowledge of initial soil moisture conditions before a rainfall event is critical to determine the magnitude of a flood event. The presentation will describe the theoretical background for using satellite SM products in flood prediction, and will show examples for understanding the critical role of initial soil moisture for predicting floods.
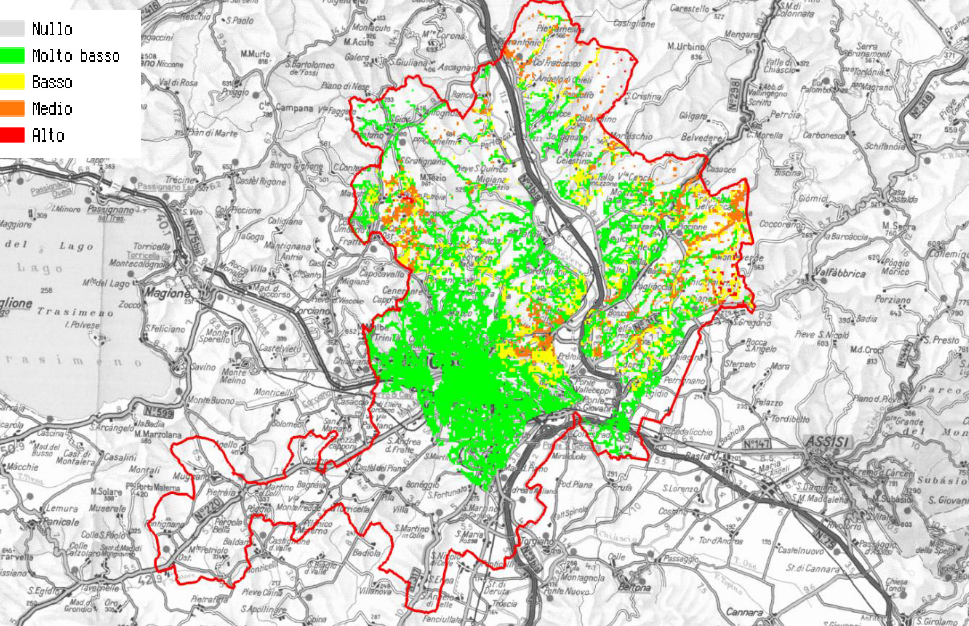
Nicola Berni presents the impact of soil moisture products for flood and land slide warning.
Length: 17 minutes.
Umbria Region Civil Protection Early Warning center (Central Italy) is in charge of alerting and monitoring critical events for Civil Protection purposes (mainly landslides and floods). In last ten years the office has used, in cooperation with national research institutes, satellite data to improve modeling/forecasting tools performances, monitoring activities about possible impacts of severe rainfall events able to trigger floods and landslides at regional scale. In fact, the estimation of the soil water content has proved to be a key parameter for better forecast models implementation both for landslide than for flood risk issues.
Silvia Puca presents how satellite products impact the efficiency of hydro-meteorological warning.
Length: 28 minutes.
Many severe meteorological events occurred in Europe during the last decade and caused casualties and damages to the historical heritage and natural environment. Protection of civilians and safeguard of the territory are the kay mandates of a civil Protection (CP) agency. This is achieved through activities that mitigate hydro-meteorological risks, such as flooding and droughts. European CP agencies, supported by meteorological and hydrological institutes, aim to assess risk scenarios, to monitor and supervise events and risk levels, providing early warning to National and local authorities.
Near real time accurate estimations of hydrological variables such as precipitation and soil moisture are invaluable to the CP agencies, enable them to issue early warnings and plan for disaster relief at the local level.
Besides measurements of key hydrological variables by ground-based instruments, often affected by a limited spatial coverage, advanced satellite-based precipitation and soil moisture products developed within different international programs as H SAF, are available and accessible to users in near-real time.
In this study, recent severe meteorological events are selected in order to understand how the main satellite product characteristics, i.e. accuracy, spatial pattern and resolution, update frequency and latency, impact the efficiency of a hydro-meteorological early warning system at a local level in an operational framework.
Jean Marc Moisselin presents methods to detect IWC from satellite data.
Length: 45 min
Author: Jean-Marc Moisselin (Météo-France)
Large amount of ice particle may cause erroneous aircraft probe measurement and damage aircraft engines. The ice crystals are generally located near cores of deep convection and associated cirrus anvils, at high altitude and in tropical areas. The understanding of the phenomena and its forecast are a key issue for aviation. There are several methods to detect clouds associated with ice crystal icing: MSG-CPP High IWC Mask, DARDAR, PHIWC, Alpha, RDT(detects and tracks convective systems).
A series of fields experiment in tropical regions have been conducted separately or conjointly by HAIC and HIWC projects. During HAIC campaigns, RDT has been provided on an operational basis through dedicated MétéoFrance processing chains. Qualitative and quantitative studies provided reasonably good results, especially in terms of probability of detection.
A new day-time attribute (adapted from MSG-CPP High IWC Mask algorithm) has been implemented in RDT v2016. Now RDT is produced globally by using five geostationary satellites, which in turn increased operational applications. New generation of satellites and the feedback on products performance will help to improve retrieval of the hazard and to define future research fields.
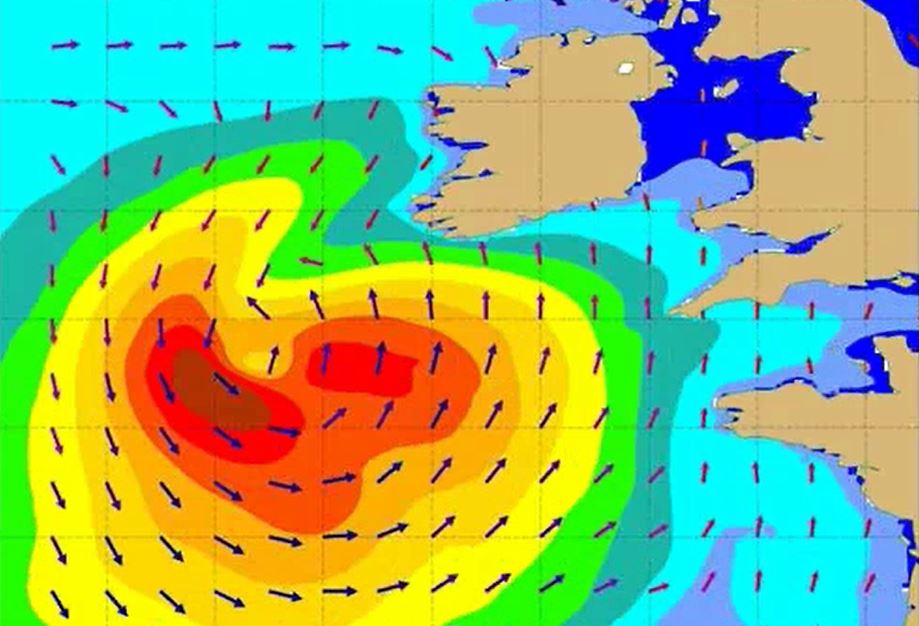
Joseph Sienkiewicz discusses forecasting challenges for large ocean areas along with the application of satellite winds and waves.
Length: 60 min
Author: Joseph Sienkiewicz (NOAA)
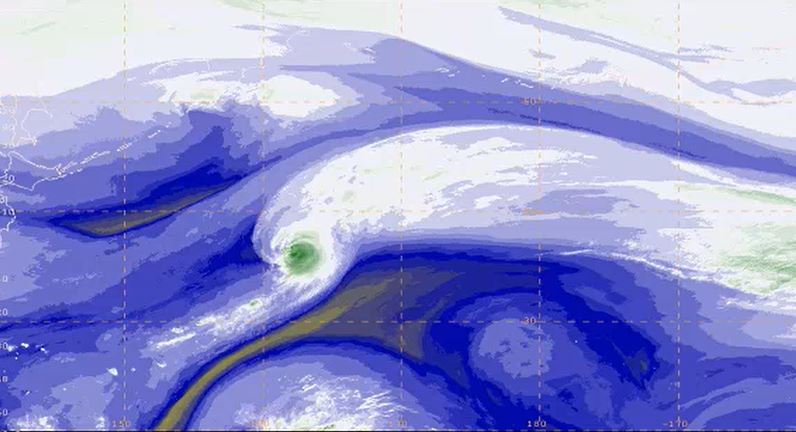
The NOAA Ocean Prediction Center (OPC) is responsible for weather warnings and forecasts for the western North Atlantic and eastern and central North Pacific Oceans. The oceans remain relatively data sparse for observed conditions. To compensate, OPC has successfully used winds from scatterometers and wave heights from altimeters to better understand and predict hazardous conditions over the waters of responsibility. Weather forecasting challenges for large ocean areas will be discussed along with the application of satellite winds and waves.
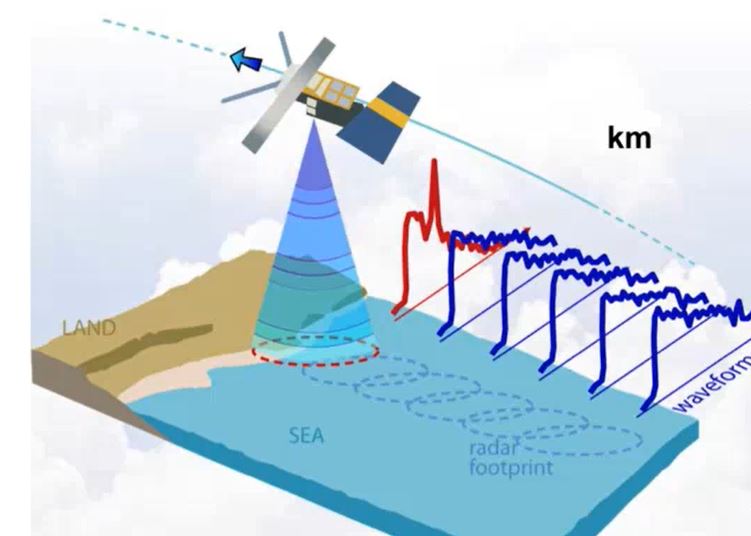
Zorana Jelenak describes how altimeters work, how data is used for everyday marine forecasting at NOAA and assimilation.
Length: 60 min
Author: Zorana Jelenak (NOAA)
Altimeter data have been used to produce maps of sea surface height, geostrophic velocity, significant wave height and wind speed. This information is of proven use to mariners as well as to the scientific community. Uses of the data include commercial and recreational vessel routing, ocean acoustics, input to geographic information systems developed for the fishing industry, identification of marine mammal habitats, fisheries management and monitoring ocean debris. Such information is accessible in near-real time (within 3 to 48 hours) and to improve weather forecasting models by assimilation. 25 years of data makes it possible to study the whole ocean or regional areas for offshore industries or navigation. In hurricane studies altimetry measures very high waves and strong winds, but also helps identify sea surface height anomalies which can be used as proxies of the warm currents - hurricanes energy source. The lecture will describe how altimeters work, how data is used for everyday marine forecasting at NOAA and assimilation, devoteting special attention to data accuracy and limitations.
Jean Bidlot gives an overview on the ECMWF wave model products.
Length: 50 min
Author: Jean Bidlot (ECMWF)
Wave models are able to give a very detailed description of the conditions at the surface of the oceans. The mean sea state is fully described by the 2d wave spectrum. This detailed description is however not always very practical and the bulk of the information contained in the 2d spectrum is usually reduced in the form of a set of integrated parameters, from a simple few such as significant wave height, mean wave direction and mean wave period, to more sophisticated parameters that described distinct part of the wave fields. Recent advances in the understanding of wave dynamics have lead to the development of new set of parameters that give information on the possible largest single wave that might exist over a certain area within a certain time frame. It is now possible to describe the sea state with different level of complexity depending on the user needs.
Michael Folmer presents examples of relevant applications of Sentinel-3A data.
Length: 55 min
Author: Michael Folmer (NOAA)
The EUMETSAT-operated Copernicus Sentinel-3A satellite has been providing near-real time data to the marine community since mid-2016, and will be soon be joined in operations by its sister, Sentinel-3B. This presentation will give an overview of the available Sentinel-3 marine products, with a primary focus on data streams associated by the altimeter (SRAL) and sea surface temperature radiometer (SLSTR). Examples of the relevant applications will be presented, along with a discussion of how users can best access data and monitor its quality.
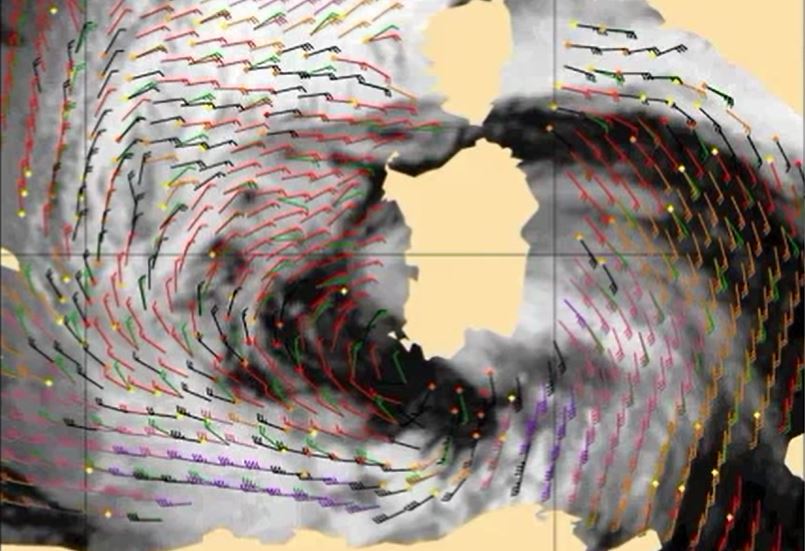
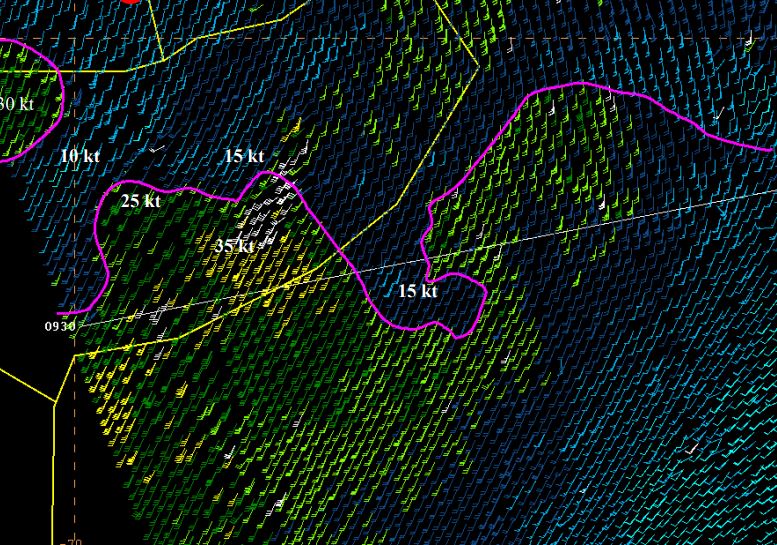
Ad Stoffelen focuses on scatterometer winds, how good they are and what aspects need attention.
Length: 60 min
Author: Ad Stoffelen (KNMI)
Winds over sea are essential for marine forecasting and used in nowcasting and numerical weather prediction (NWP) to aid in off-shore activities (energy sector, transport, fisheries and recreation), particularly to secure safety of life and property. Winds over sea are observed by satellites and available from NWP model forecasts. Most satellite winds over sea are provided by scatterometers; they provide swath fields of both wind speed and wind direction from polar satellites. Currently, winds from EUMETSAT’s MetOp-A, MetOpB and the Indian ScatSat-1 are operationally available and provide good coverage around 9:00 and 21:00 local solar time (LST). Very soon they will be complemented by a few more. The lecture focuses on what scatterometer winds really represent, how good they are and what aspects need attention when applying these winds in your routine operations alongside with NWP model winds.