
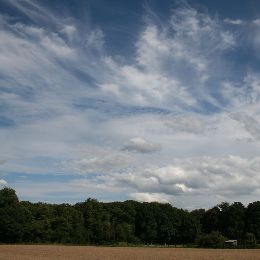
Identify cloud types and their characteristics
Georg Pistotnik talks about the role of vertical wind shear in storm organization.
Length: 30 min
Author: Georg Pistotnik (ZAMG)
Next to sufficient instability, strong vertical wind shear is the main driver that promotes thunderstorms to organize into multicells, supercells or lines, which are more probable to attain a longer lifetime and to produce severe weather phenomena like hail or wind gusts. The role of vertical wind shear in storm organization is explained in this presentation, and selected case studies illustrate how favorable conditions for severe storms can evolve either by large-scale processes or, more challenging for forecasters, by local modifications of the wind systems and associated temperature and humidity changes.
An intensive training module on the operational use of RGBs in the forecasting room.
Technological advances and the increasing sophistication of weather forecasting have created a demand for more frequent and more accurate and higher resolution observations from space. To meet this demand on 28th August 2002 the first of four satellites known as Meteosat Second Generation (MSG) was launched.
MSG transmits more than 20 times the information of its predecessor. The improved resolution of frequency of data significantly contributes to the accuracy of both short-term and medium range weather forecasts. Since 2004, the MSG satellites have been providing full Earth disc images every 15 minutes, in 12 spectral bands.
Twenty times more information is also a challenge for the user to cope with. To present all of this extra data in a understandable way to the user, so-called RGB (red, green and blue) images were developed that allow you to easily make a qualitative analysis. In RGB images the different properties of the twelve spectral bands of MSG are combined in one powerful coloured image.
Fog, snow, atmospheric dust, SO2 clouds from erupting volcanoes, severe updrafts in convective systems, Potential Vorticity (PV) anomalies are just a few keywords and applications that we will teach you to recognise in satellite imagery. On several occasions questions and exercises will help you to test your gained knowledge.
Icing still represents a major threat to aviation. This CAL module focuses on the occurrence of icing in stratiform clouds. A method to detect icing probability from satellite images in combination with radar and radiosonde data is presented.
Ice formation on wings and inside of the jet engine of planes causes around 15% of weather related aircraft accidents. Most icing occurs inside cumulonimbus clouds when supercooled droplets freeze with contact of the aircraft body. But also in stratiform clouds icing represents a major threat to aircrafts during landing and take-off phase. In this CAL module, icing hazards related to stratiform clouds are examined. The introductory chapter focuses on the different types of icing and the physical principles leading to ice formation on aircrafts. Satellite products from geostationary and polar orbiting satellites help differentiating between ice and water clouds. A sample of satellite images and products illustrate this capability. Additional data sources like radiosoundings and radar imagery are useful completions to the satellite data. Interpretation of radiosoundings in view of icing occurrence is the main topic of chapter 4. The usefulness of radar data for detecting ice clouds is demonstrated. Three case studies complement the theoretical part of the training module, showing typical weather situations where severe icing represented a serious threat to aircrafts in the past. These case studies combine the above mentioned data sources in the frame of a practical situation. The CAL module finishes on a suggested procedure for nowcasting icing from stratiform clouds. Exercises offering the possibility to test the acquired knowledge form the end of this module.
In this CAL module you will learn to detect areas with the risk for Clear Air Turbulence (CAT). This will be done with the help of satellite images, soundings, flight reports and analyses of the airflow.
Clear Air Turbulence is one of the most frequent hazards for civil aviation. It is also one of the biggest challenges for forecasters to detect and warn for possible Clear Air Turbulence occurrence.
In this CAL module you will learn to detect areas with a high risk for Clear Air Turbulence (CAT). This will be done with the help of satellite images, soundings, flight reports and analyses of the airflow. Practical examples will show you how to apply your knowledge.
This CAL module deals with applications of MSG water vapour images in operational forecast departments. It focusses on the analysis of WV imagery in view of turbulence, cyclogenesis, convection and deformation zones.
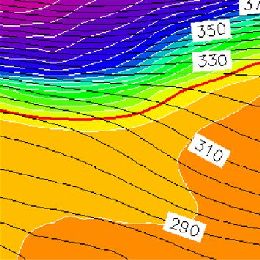
This training module gives an overview on applications of MSG water vapour channels for operational weather forecasting. It handles the concept of potential vorticity which is a key feature to understand the dynamic processes in the higher Troposphere such as cyclogenesis. The CAL module also shows practical applications of the WV images from the geostationary satellites for locating tropopause foldings, clear air turbulence and deformation zones. It handles the effects of WV boundaries on the initiation of convective processes and finally presents some meteorological products heavily based on WV imagery.
An intensive training module on the operational use of RGBs in the forecasting room.
The new generation satellite data contains more and more information offering increased insight into cloud and air mass characteristics. This poses a challenge: figuring out how to extract, distill and package the data into products that are easy for forecasters to interpret and use.
One might create numerous different kinds of RGB images. Satellite experts developed some optimally tuned RGB types for highlighting specific features. These are the so called standard RGBs recommended by EUMETSAT. The advantage of using standard RGBs is their easy comparability.
The aim of creating RGBs is to provide fast, easily understandable VISUAL information. A 'good' RGB should convey information that would be difficult or time consuming to assess visually from one or more individual single channel images. RGB image should be unambiguous and use intuitive colours to help highlighting important meteorological and surface features. RGBs provide useful information to forecasters, in particular when looking at animated image sequences. They preserve the "natural" look-and-feel of "traditional" satellite images, e.g. they preserve texture, and the patterns are continuous in time.
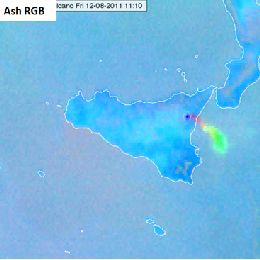
In this module you will learn more about the EUMETSAT standard RGBs: HRV Fog RGB, Snow RGB, Night Microphysics RGB and the Ash RGB.
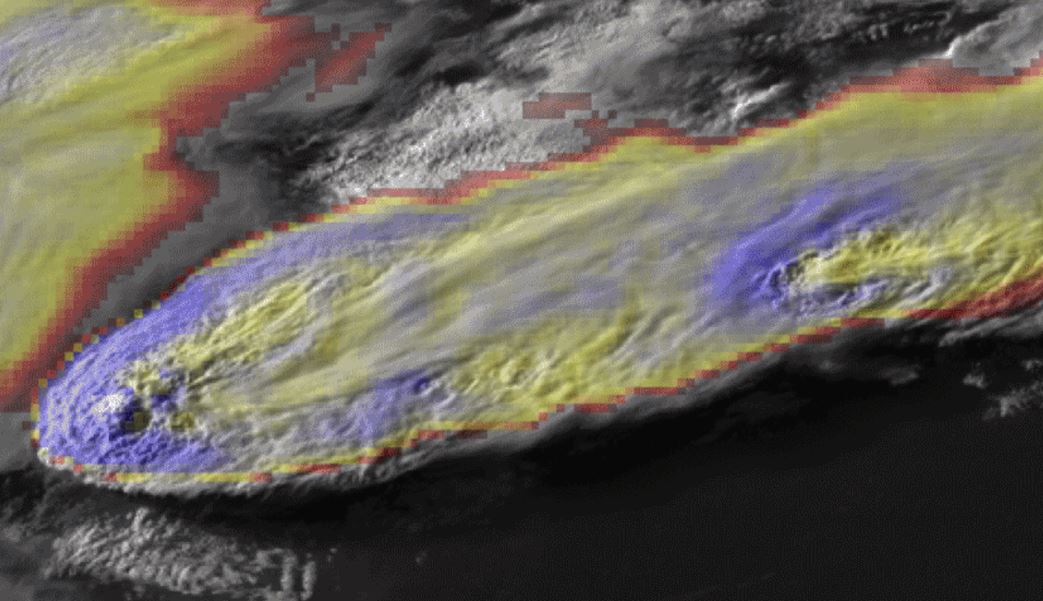
This module treats all kinds of atmospheric gravity waves over land and over the oceans.
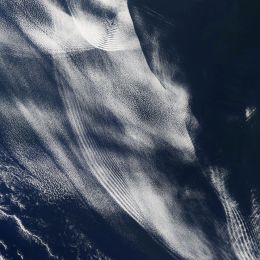
This module treats all kinds of atmospheric wave phenomena, starting with Lee Waves and ending with Vortex Streets. The physical background of Gravity Waves in general and Lee Waves in special will be highlighted and special cases, such as Foehn clouds, treated in more details. Gravity waves over the oceans build another focal point of this module. At the end of each chapter, exercises will help you to check the acquired knowledge.
The purpose of this training module is to give an overview on the different RGB types created from the AVHRR instrument.
This training module describes MetOp AVHRR (Advanced Very High Resolution Radiometer) RGB schemes that are based on EUMETSAT recommendations. The 'recipes' were tuned to create high quality MetOp/AVHRR RGB images as similar as possible to the SEVIRI RGB schemes recommended by EUMETSAT.
The main aim of the training module is to help the users (weather forecasters and/or other experts) understand and use these RGB types by giving them background information, examples and exercises.
The module takes the following structure:
- The aim of the RGB type
- Physical background
- How to create the given RGB type
- Typical colors
- Examples of interpretation
- Benefits and limitations
- Comparisons with other RGB types and/or single channel images
- Exercise
Hervé le Gléau focuses on cloud top height and micro-physics that can be retrieved from the NWCSAF/GEO software.
Length: 25 minutes.
This talk focuses the cloud top height and microphysics that can be retrieved from the NWCSAF/GEO software. The algorithms will be outlined, the improvements implemented in the last version (v2018 just released this year) will be highlighted and some validation results will be shown. After having given some perspective for MTG-day1 release, a convective situation over France will be illustrated.
Jean Marc Moisselin presents methods to detect IWC from satellite data.
Length: 45 min
Author: Jean-Marc Moisselin (Météo-France)
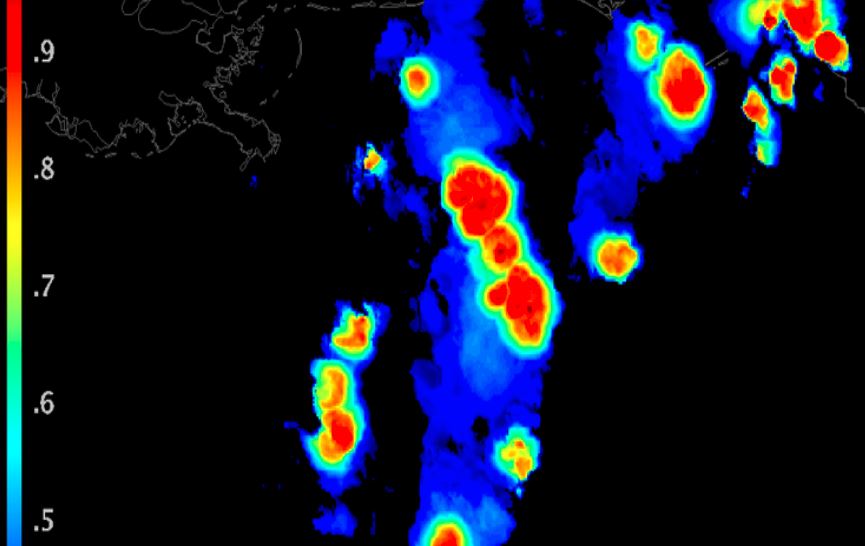
Large amount of ice particle may cause erroneous aircraft probe measurement and damage aircraft engines. The ice crystals are generally located near cores of deep convection and associated cirrus anvils, at high altitude and in tropical areas. The understanding of the phenomena and its forecast are a key issue for aviation. There are several methods to detect clouds associated with ice crystal icing: MSG-CPP High IWC Mask, DARDAR, PHIWC, Alpha, RDT(detects and tracks convective systems).
A series of fields experiment in tropical regions have been conducted separately or conjointly by HAIC and HIWC projects. During HAIC campaigns, RDT has been provided on an operational basis through dedicated MétéoFrance processing chains. Qualitative and quantitative studies provided reasonably good results, especially in terms of probability of detection.
A new day-time attribute (adapted from MSG-CPP High IWC Mask algorithm) has been implemented in RDT v2016. Now RDT is produced globally by using five geostationary satellites, which in turn increased operational applications. New generation of satellites and the feedback on products performance will help to improve retrieval of the hazard and to define future research fields.
Kris Bedka talks about methods helping to detect hazardous weather situations for aviation.
Length: 30 min
Author: Kris Bedka (NASA)
Current generation geostationary satellites are observing convection that is hazardous to aviation at increasingly high spatio-temporal detail. In recent years, commercial and research aircraft have collected automated turbulence and cloud ice water content observations that can be used to better understand exactly where within deep convection the turbulence and icing conditions are typically occurring. Ground-based weather radar and severe weather reports also identify locations of hail, downburst wind, and tornadoes. Research conducted at NASA Langley Research Center (LaRC), in collaboration with a number of U.S. and international partners, has resulted in geostationary-based analyses and automated detection algorithms that can denote where turbulence, icing, and severe weather conditions are likely. These methods are applicable to any geostationary visible and IR imager across the globe and therefore can be used to map these weather hazards in nearreal time, a capability that is especially valuable over regions without weather radars and other conventional observations of aviation hazards.
Alexander Jann and Andreas Wirth present the new aviation products of ASII-NG (Next Generation).
Length: 30 min
Author: Alexander Jann, Andreas Wirth (ZAMG)
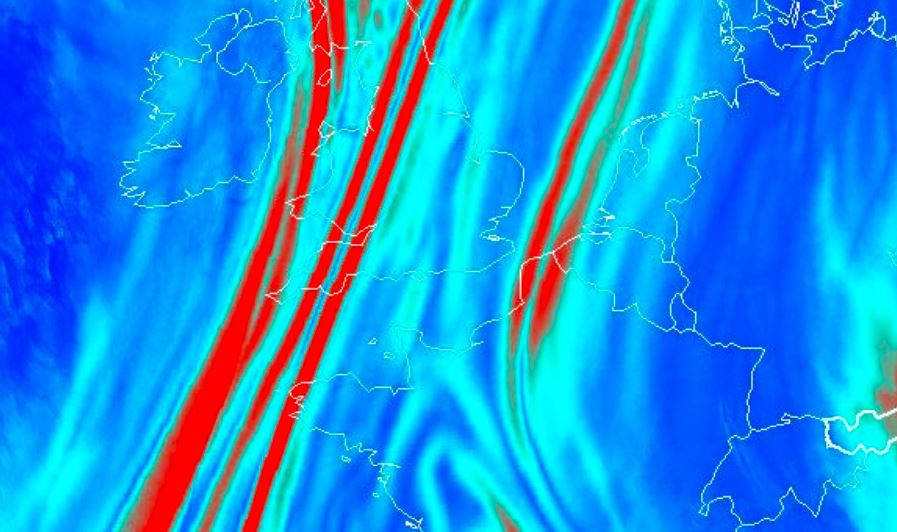
Two new satellite-derived products related to turbulence analysis have been developed recently in the frame of the Nowcasting-SAF. The first product (ASII-GW”Automatic Satellite Image Interpretation – Gravity Waves”) objectively detects grating patterns in the water vapor 7.3 imagery which point to the presence of gravity waves. The second product (ASII-TF “Automatic Satellite Image Interpretation – Tropopause Folding”) identifies the location of tropopause folds from satellite and NWP data. The algorithm is based on the logistic regression method.
In this presentation, we will talk about the selected algorithms and present cases from the official Nowcasting-SAF validation reports (to be released shortly) to illustrate the product performance.