Mature thunderstorm system
Some features on the mature convective thunderstorm (system) cloud top, if present, could indicate the severe nature of the storm. Such cloud top features are: intense, long-lasting overshooting tops (OT); frequent, intense OTs, intense gravity waves, long-lasting cold ring or cold-U/V shapes in the IR10.8 image, presence of an ice plume etc. These features, if present, are mainly seen in HRV and/or in IR10.8 channels. HRV shows the cloud top morphology due to shadows and IR10.8 shows the brightness temperature distribution.
In Fig. 7.6 we show an IR10.8 image on the studied windstorm, enhanced with the standard color scale. Both the left and right panels show the same image, but on the right panel the color scale is shifted by 5 K degree towards the warmer temperatures to obtain a better contrast. The tropopause was relatively low, which is why the cloud top temperature was not so cold. (The tropopause temperature was about -55 °C at 12 UTC according to the de Bilt radiosonde measurement, see Fig. 5.4. The anvil temperature was around -56 °C, while the temperature of the overshooting tops was about (-61)-(-66) °C.)
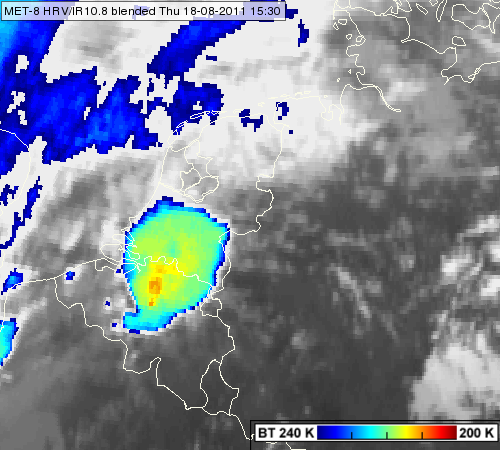
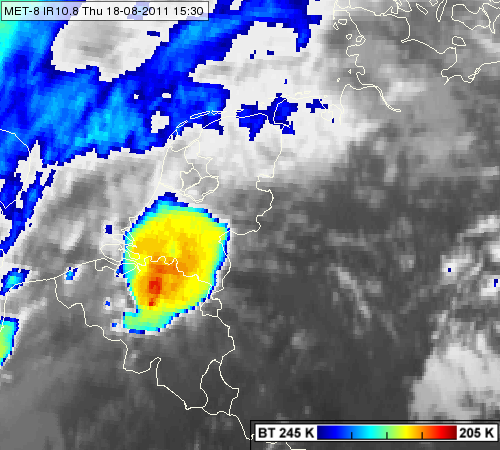
Fig. 7.6. Meteosat 8 IR10.8 images from 15:30 UTC enhanced with the standard color scale (left) and with the same color scale but shifted towards the warmer temperatures by 5 K (right)
Click here to see the animation created from 5-minute IR10.8 images between 11:35 18:35 UTC.
A new visualization method was developed to combine the HRV and the IR10.8 channel data to see the cloud top features better. This is the so-called HRV/IR10.8 blended image (or 'sandwich' image). You can read here about the 'sandwich' product.
In Fig. 7.7 HRV/IR10.8 blended images are presented in four slots. In the animation we can follow the evolution of cloud top features easily. Intense OTs are seen during the whole period. Some were long-lasting. Intense gravity waves are present in many images, for example at 16:10 UTC. The first warm spot appeared at 14:30 UTC. Cold ring features can be recognized from 15:15 UTC. An ice plume appeared at 15:50 UTC and it could be seen until the sun went down.
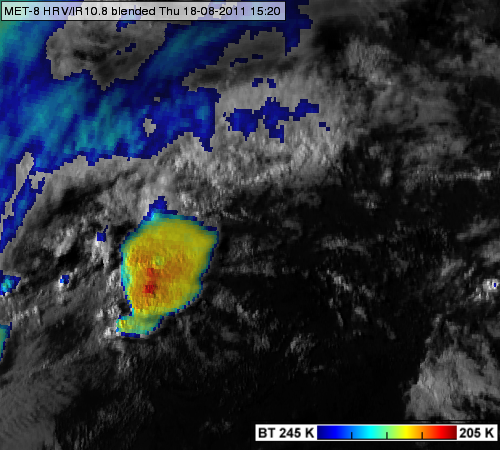
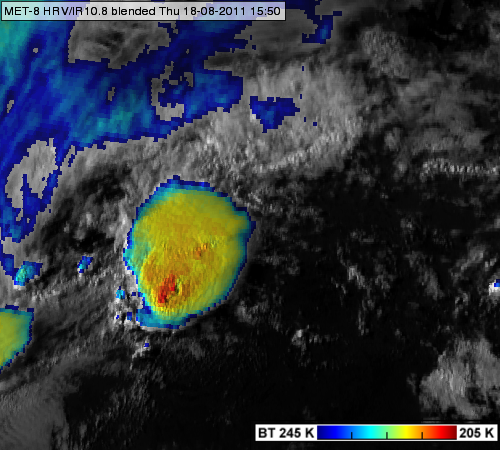
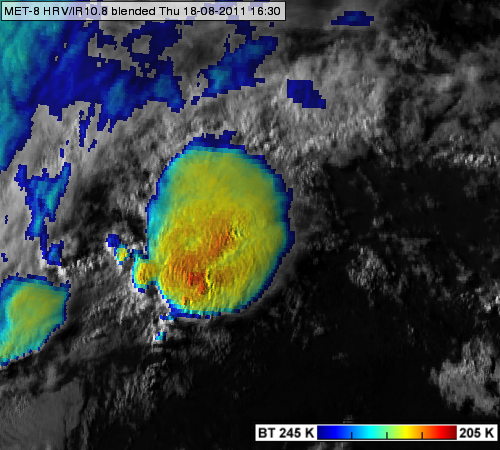
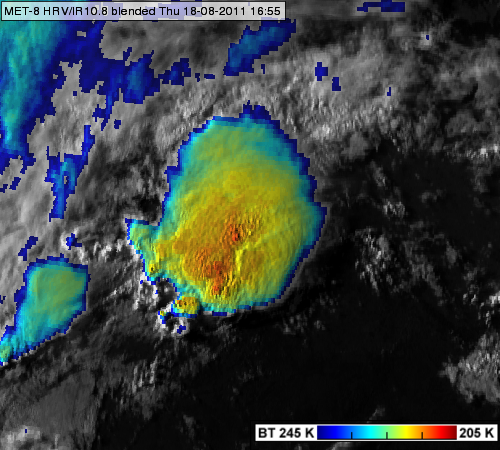
Fig. 7.7. Meteosat 8 HRV/IR10.8 blended images for 15:20 (upper left), 15:50 (upper right), 16:30 (below left) and 16:55 (below right) UTC.
Click here to see the animation created from 5-minute HRV/IR10.8 blended images between 11:35 18:35 UTC.
Cloud top microphysics could give information on updraft intensity. Strong updrafts usually produce small ice crystals at the cloud top. The studied thunderstorm system has a yellowish color in the severe storms RGB, in spite of the fact that its cloud top was not so cold. In the present case the yellowish color indicates the presence of small ice crystals in the cloud top, which in turn implies the presence of a strong updraft (Fig. 7.8.).
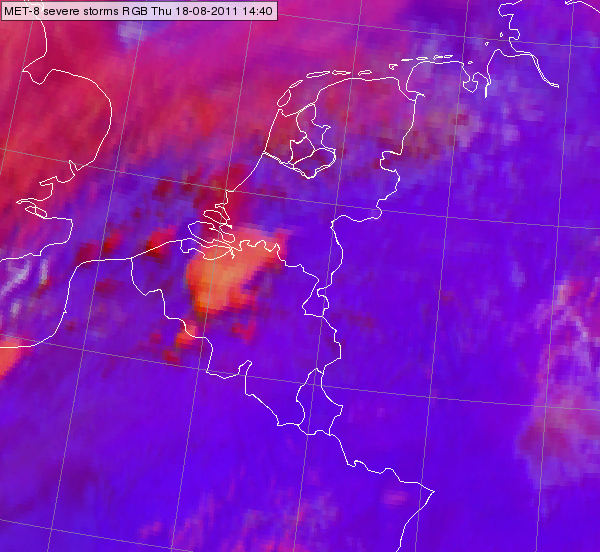
Fig. 7.8. Meteosat 8 severe storms RGB for 14:40 UTC