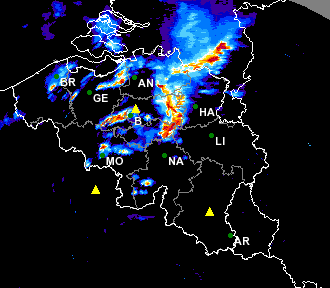
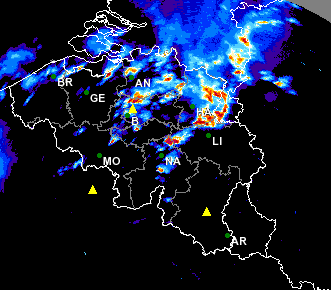
The radar imagery showed a bow echo in the studied storm system at several time steps. At 15:55 UTC it was located between Brussels and Hasselt (Fig. 5.1 left panel, Brussels and Hasselt are indicated by 'B' and 'HA' on the map). 45 minutes later, about the time when the windstorm hit the festival, this bow echo was even more folded around Hasselt (Fig. 5.1 right panels).
![]()
Fig. 5.1. Radar column maximum product for 15:55 UTC (left) and for 16:40 UTC (right). Composite image of two radar measurements. Source: RMI
Click here to see the animation created from 5-minute radar data between 12:00-21:00 UTC.
Fig. 5.2 shows the 'Probability of hail' product. Around 16 UTC when the windstorm hit the festival the radar showed more than 90 % probability of hail.
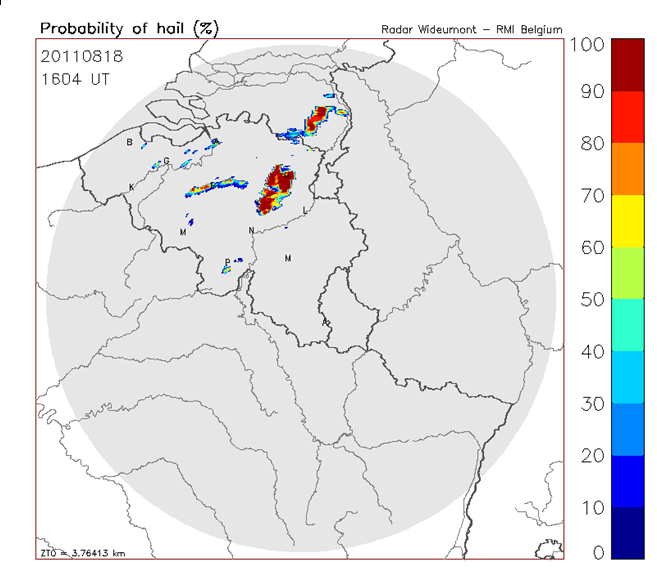
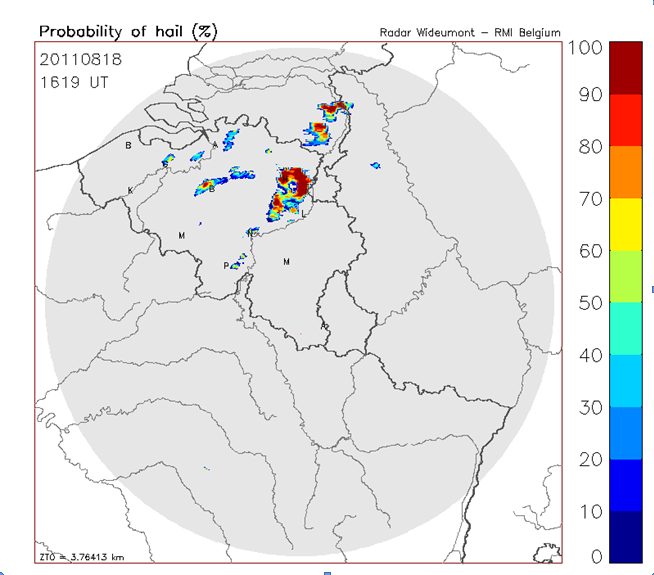
Fig. 5.2. Probability of hail retrieved from radar data for 16:04 UTC (left) and 16:19 UTC (right), source RMI
Fig. 5.3 shows the 'Echotop' radar product, the height of the cloud. The measured cloud tops were at about 13 km, in some smaller areas even higher. This means that the storm system penetrated well into the stratosphere as the radiosonde in de Bilt (Netherland) at 12 UTC measured less than 12 km tropopause height (Fig. 5.4).
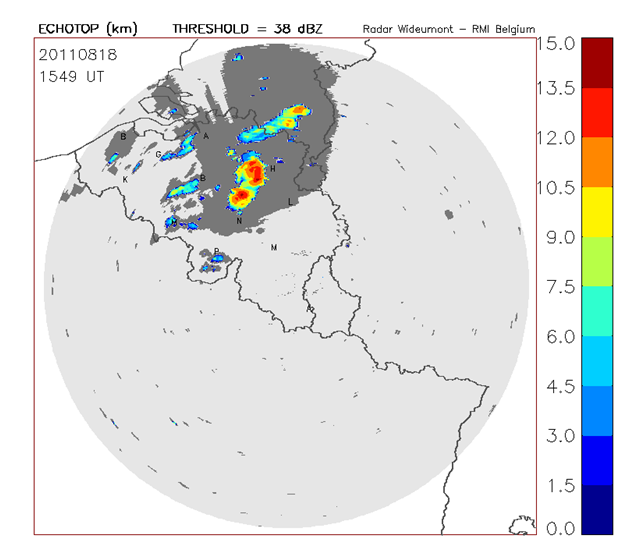
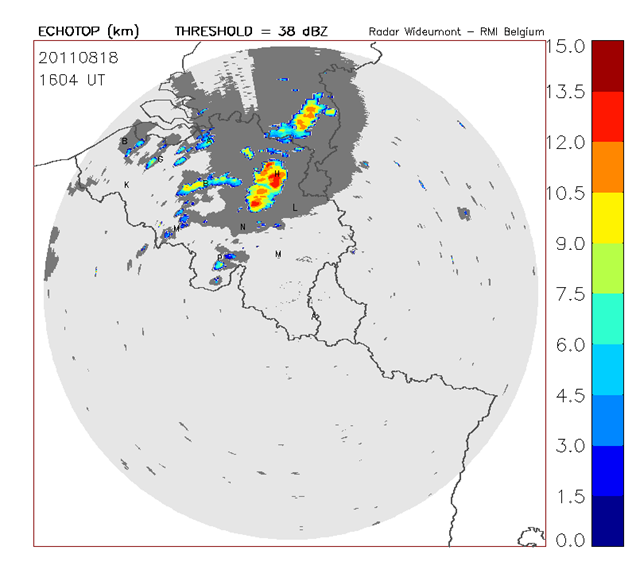
Fig. 5.3 Echotop radar product for 15:49 UTC (left) and 16:04 UTC (right), source: RMI
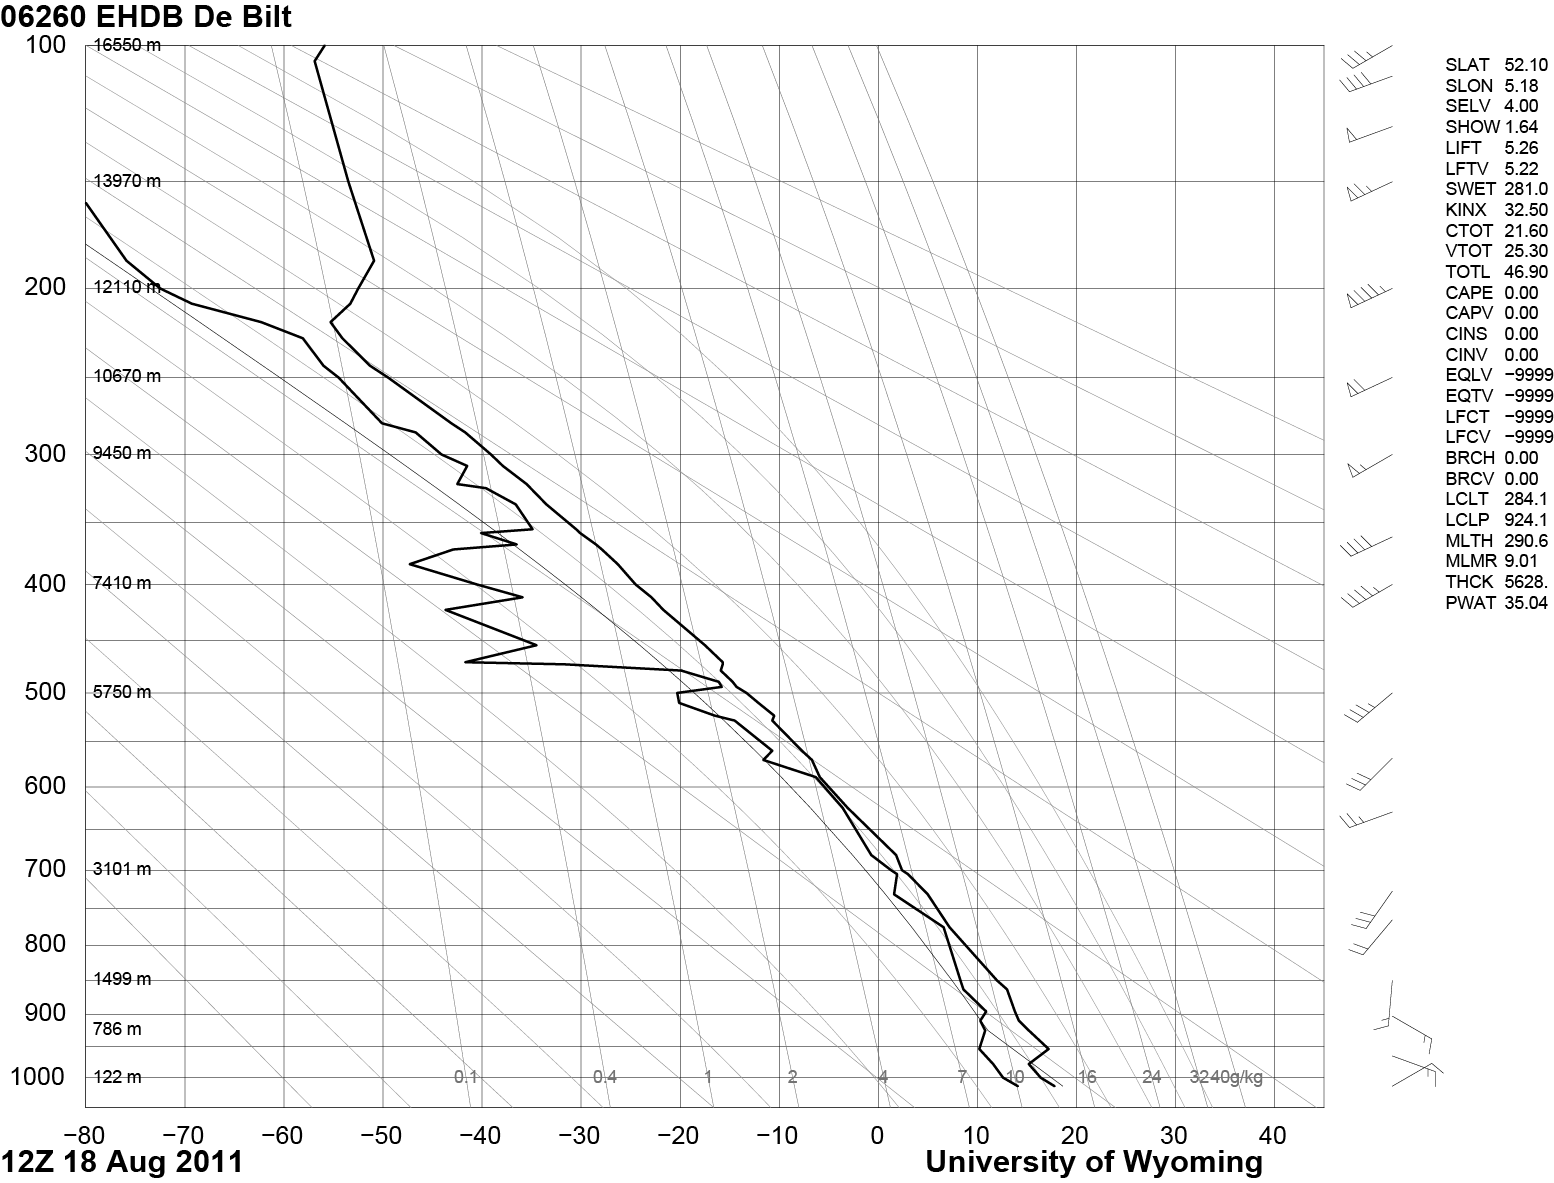
Fig. 5.4. Radiosonde measurement in de Bilt, the Netherlands at 12 UTC. Source: http://weather.uwyo.edu/upperair/sounding.html
For comparison we present the satellite-retrieved cloud top height product of NWCSAF (Fig. 5.5). Here the cyan color corresponds to a height of 13,2 km.
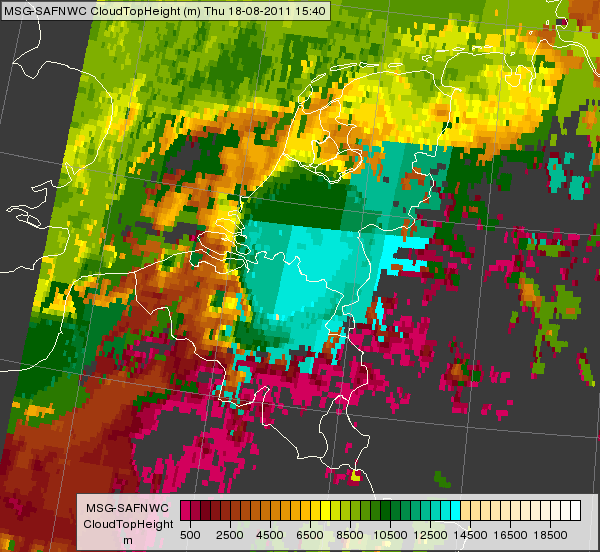
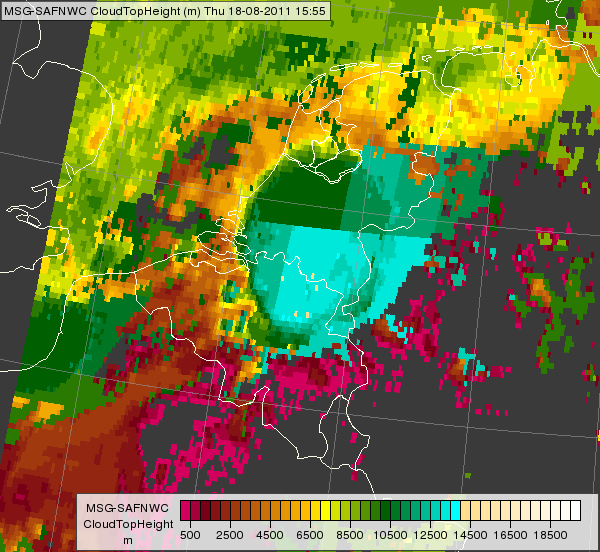
Fig. 5.5. NWCSAF Cloud Top Height (CTTH) product at 15:40 UTC (left) and 15:55 UTC (right).
You can read more about the NWCSAF CTTH product here.