Convection initiation
The aim of the Convection Initiation (CI) product is to find the towering, rapidly developing cumulus clouds just crossing the zero °C isotherm. Based on the SATCAST box-average method 5-minute Convection Initiation (CI) product was produced at the Hungarian Meteorological Service for the studied windstorm. It was found that the first cells which later contributed to the windstorm system initiated at about 12:20-13:00 UTC over France and Belgium; see Fig. 7.3 and the animation.
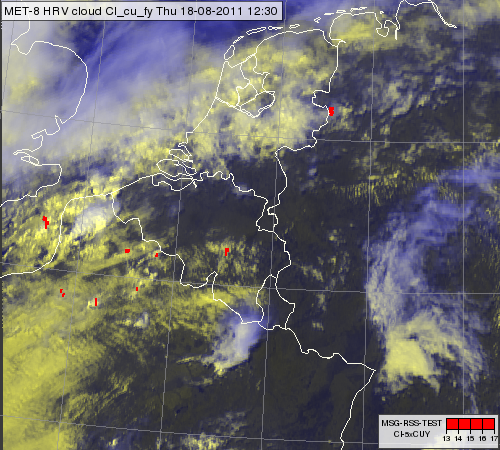
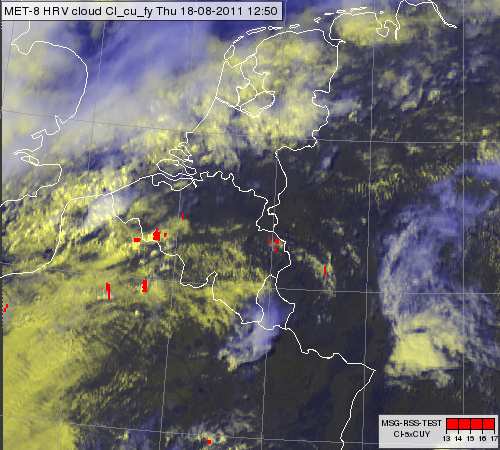
Fig. 7.3. Meteosat 8 HRV cloud RGB image for 12:30 UTC (left) and 12:50 UTC (right) overlaid by the Convection Initiation product (red pixels) showing the rapidly developing cumulus clouds.
Click here to see the animation created from 5-min HRV cloud RGB and CI data between 11:35 and 16:05 UTC.
It is reasonable to use the CI product together with clear air products (moisture and instability). For convection instability, moisture and lift are needed. CI shows whether lift is present, while clear air products show whether instability and moisture are present.
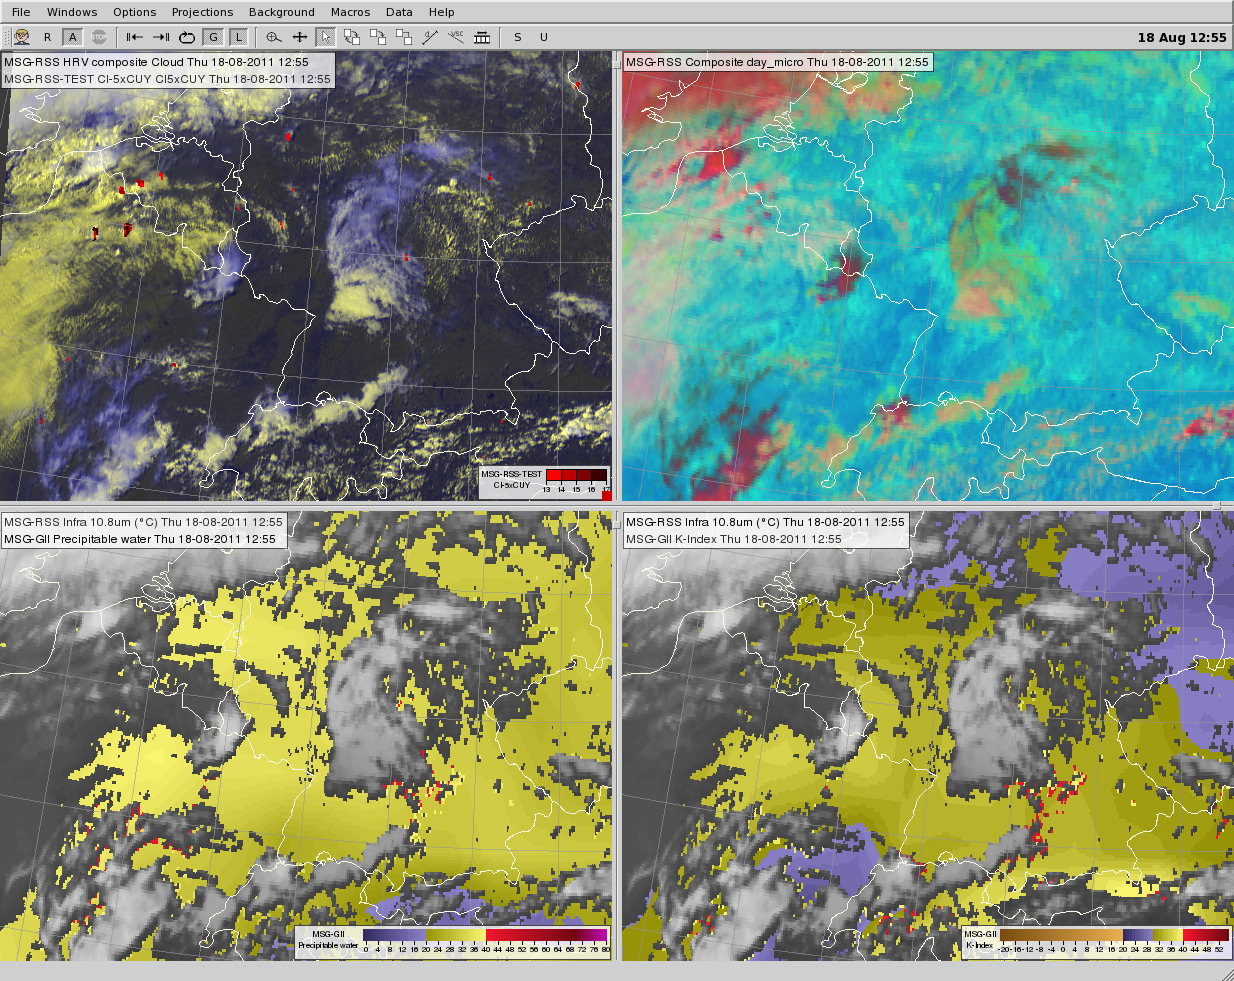
Fig. 7.4. Meteosat 8 satellite images and products for 12:55 UTC. HRV cloud RGB image overlaid by the Convection Initiation product (upper left), day microphysics RGB (upper right), IR10.8 image overlaid by the GII total precipitation product (lower left) and IR10.8 image overlaid by the GII K index product (lower right).
The day microphysics RGB shows the process of cloud top glaciations (the color turns to red), so this RGB is very informative in the convection initiation phase.
The Rapid Developing Thunderstorm (RDT) product of NWCSAF showed that these cells cooled fast. RDT detects the convective cloud systems and also characterizes them by calculating several quantities, like cooling rate. Note that RDT was run at OMSZ with lightning data (optional input) to make the convective cloud detection more effective in the developing phase.
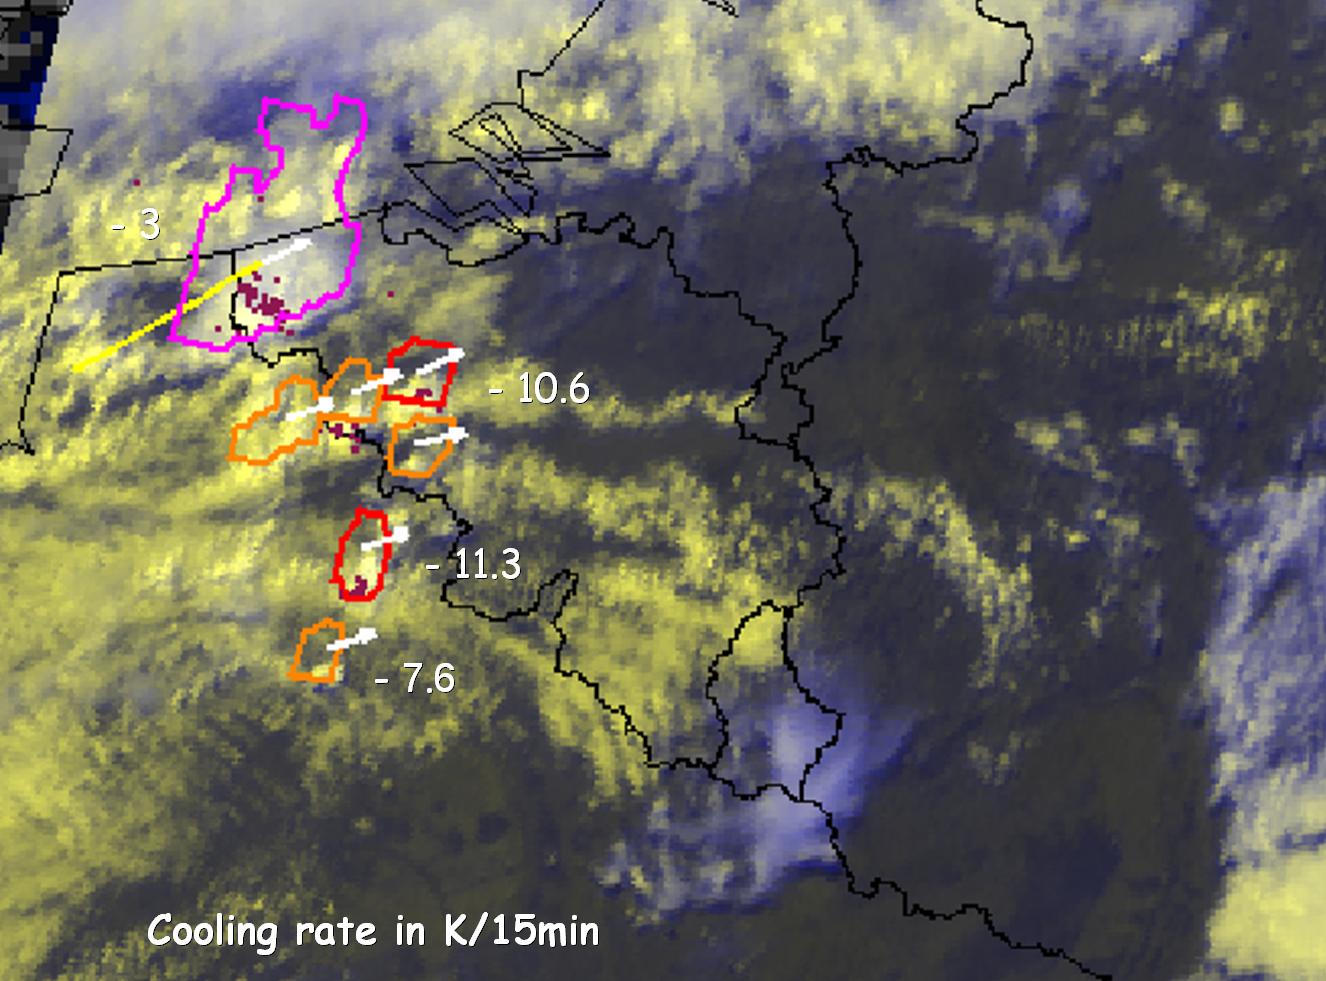
Fig. 7.5. Meteosat 9 HRV cloud RGB image for 13:10 UTC overlaid by 10-min lightning data (dots) and by NWCSAF RDT product (contours). Developing and mature convective cells are indicated by red and pink contours, respectively. Cells detected as convective for the first time have an orange contour. The cooling rates of the detected convective cells are indicated in the image.
You can read about the NWCSAF RDT product here.