Relationship between the environmental moisture distribution and convective downdrafts
The main environment characteristics in the WRF simulation are similar to those forecast by ECMWF (which provided boundary and initial conditions for the WRF model). There was a southeasterly-easterly storm-relative inflow of warm and moist air at low levels (Fig. 3.3). The thunderstorms produced rather isolated outflows, which can be observed as local minima in the field of the equivalent potential temperature. A larger cold pool developed only in the forecast valid for 18 UTC over the west of Germany (not shown). At mid-levels (600 hPa), there was a "tongue" of dry air spreading from France toward the thunderstorm. In this level, the local maxima of the equivalent potential temperature are areas of the thunderstorm updrafts, which transport the moist air to the upper levels.
The southwest-northeast vertical cross-section of the equivalent potential temperature and storm-relative wind projected to the cross-section plane (Fig. 3.4) shows that the environmental dry air at 4 km could have entered the downdraft area in the rear of the thunderstorm. Thus, the downdraft seems to be connected with the meso-alpha synoptic region of dry mid- and upper air, which was detected in the satellite imagery.
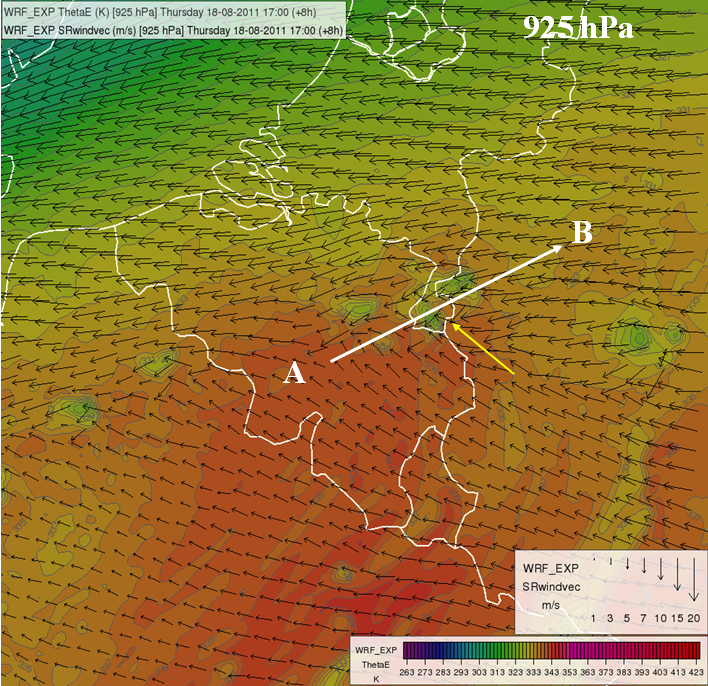
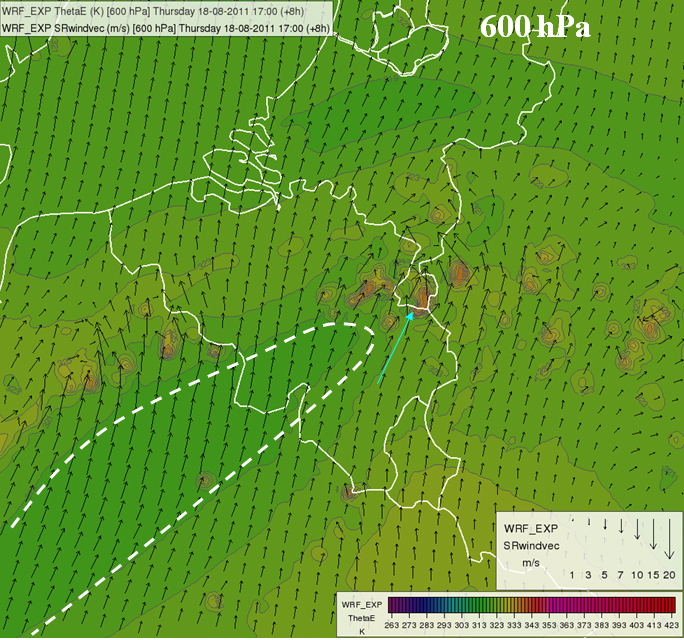
Fig. 3.3. WRF 8 h forecast for 18 August 2011 17 UTC: equivalent potential temperature (colors and gray contours) and storm relative wind vectors at 925 hPa (above) and 600 hPa (below). The white arrow and the A and B letters indicate the location of the vertical cross section analyzed in the next figure. The yellow arrow shows the direction of the storm relative inflow. The dashed white line in the panel below shows a 'tongue' of low equivalent potential temperature.
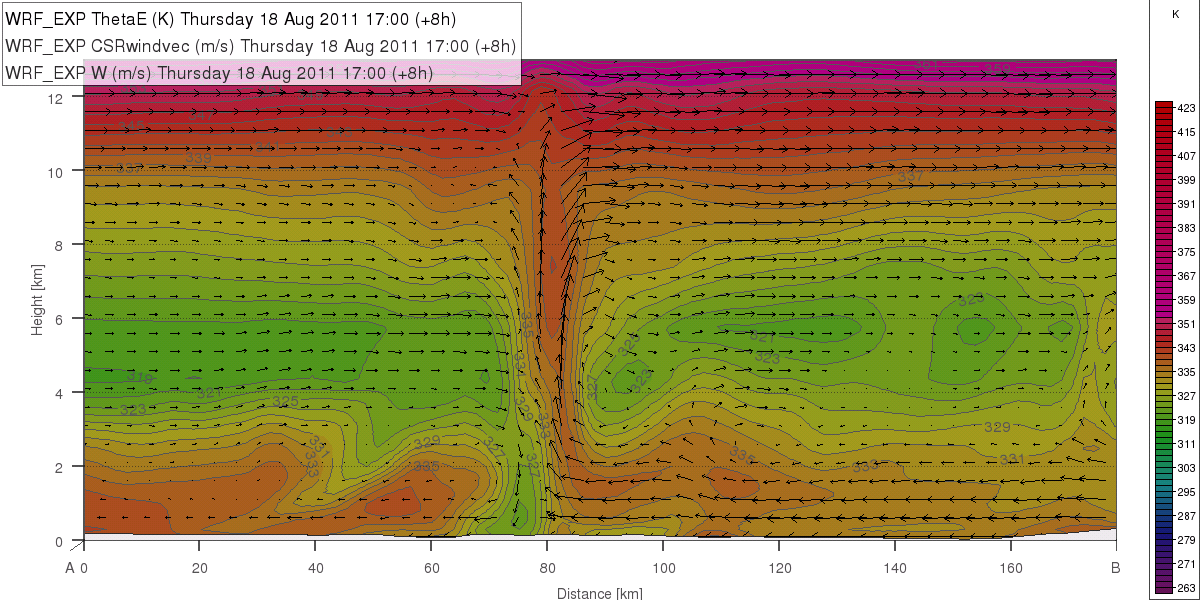
Fig. 3.4. WRF 8 h forecast for 18 August 2011 17 UTC shown along the vertical cross section indicated in Fig. 3.3. Equivalent potential temperature (colors and gray contours, K), cross section and storm-relative wind vectors (arrows, m/sec)