
Identify and interpret fields and derived products
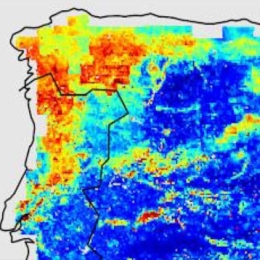
Emanuel Dutra presents an overview of the LSA SAF ET products with particular focus on the use of HSAF soil moisture in operations (H14 and future H26) and in the production of the climate data record (H141).
Evapotranspiration (ET) is a key component of the Earth System coupling land-atmosphere exchanges of water, energy and carbon. Due to the complex nature of the processes involved (radiation, boundary layer turbulence, vegetation status, soil moisture) it is very challenging to observe (locally and from Satellite) and to model. LSA SAF evapotranspiration product takes advantage of satellite radiation and soil moisture estimates to diagnose ET using a surface energy balance approach. This talk will present an overview of the LSA SAF ET products with particular focus on the use of HSAF soil moisture in operations (H14 and future H26) and in the production of the climate data record (H141).

Aynur Sensoy assesses the impact of the snow product for runoff prediction results (KGE> 0.85) and also demonstrates it in comparison to a well-known data set of MODIS.
Developing satellite technology offers new products to simulate different hydrological processes. These products are invaluable in hydrological applications for mountainous areas where observation data is relatively limited. The H SAF project offers snow products over complex topographies.
The daily snow cover dataset derived by H SAF SE-E-SEVIRI (H10) is evaluated on the mountainous terrain of the Upper Euphrates Basin. Snow-covered area data is processed and analyzed. Snow depletion curves are extracted and used as basic forcing data in a conceptual model. The impact of the product is assessed by the model performance for runoff prediction results (KGE> 0.85) and also demonstrated in comparison to a well-known data set of MODIS.
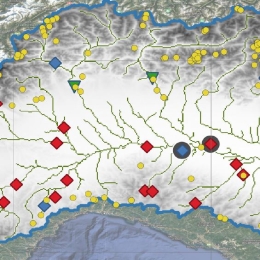
Lorenzo Alfieri shows recent advances in high resolution satellite products and their use in hydrological modelling.
This work shows recent advances in high resolution satellite products and their use in hydrological modelling. In a set of experiments, the distributed hydrological model Continuum is set up for the Po River Basin and forced by satellite precipitation and evaporation, while soil moisture and snow water equivalent are ingested through a data-assimilation scheme. All satellite products produced skilful estimates of river discharge. Satellite based evaporation and snow water equivalent marginally improve (by 2% and 4%) the mean Kling-Gupta efficiency at 27 river gauges. Interestingly, a model calibration heavily relying on satellite data provides skilful reconstruction of river discharges, paving the way to full satellite driven hydrological applications.
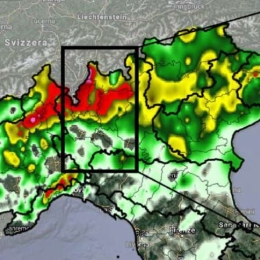
Stefano Federico presents a study, a comprehensive analysis of the July 2021 event that occurred over Como Lake (Italy), trying to provide a complete overview of all the data currently available for the analysis of this type of events.
In recent years, in some areas over Europe, there has been an incidence of extreme weather events that have severely impacted people, structures, and infrastructure, causing damage and loss. The scientific literature indicates that the scenario is evolving and that there is an increasing number of severe weather events, which makes the use of as much data as possible particularly useful.
In this study, a comprehensive analysis of the July 2021 event that occurred over Como Lake (Italy) was performed, trying to provide a complete overview of all the data currently available for the analysis of this type of events.
Marco Petracca provides an overview of SEVIRI-based precipitation products: H60, H61, H63 and H90.
Over the past few years, there has been a rising in intense precipitation events, resulting in severe effects on people and infrastructures. To meet the challenge of analysing weather events comprehensively and globally, the use of information from satellite is playing an ever-increasing role in the field of meteorology. In this context, H SAF provides data sets and products for operational hydrological applications: an overview of SEVIRI-based products will be given: H60, H61, H63 and H90. Their validation process and a direct inter-comparison between the same products with different spatial coverage will be shown to demonstrate their extended spatial validity.

Examples of downloading, reading, and displaying snow cover and snow water equivalent data in Python are presented.
H SAF snow cover and snow water equivalent products are comprised of either Near Real-Time (NRT), Offline or Climate Data Records (CDR), which are freely available at the H SAF data portal. Examples of downloading, reading, and displaying snow cover and snow water equivalent data in Python are presented.
The session includes a summary of H SAF precipitation products, with particular attention to the most recent products.
The session includes a summary of H SAF precipitation products, with particular attention to the most recent products. The procedures to get access to the data, both for short range repository (last 60 days) and longtime archive data will be described. Moreover, the main data formats will be briefly presented, including the expected format changes in the near future. Python scripts and a Jupiter notebook developed for reading and visualization of precipitation data will be also presented.
Additionally, an example of Flood modelling with satellite rainfall data in Africa will be shown. Flood modelling over data scarce regions is challenging. Satellite rainfall data offer a viable tool to force hydrological models and provide discharge prediction at ungauged sites. However, being an indirect type of measurements, satellite rainfall observations can be subjected to significant bias and might be suboptimal over mountainous terrain. Here we show that model recalibration or bias correction even with a few rain gauges can provide boost hydrological model performance and thus make satellite rainfall data a valid solution to obtain discharge.
A demonstration session that gives an overview on how to download, read and visualize H SAF soil moisture data using the Python programming language.
The demonstration session gives an overview how to download, read and visualize H SAF soil moisture data using the Python programming language. Jupyter notebooks are used to present code examples, which are hosted at GitHub. H SAF Surface Soil Moisture (SSM) and Root-Zone Soil Moisture (RZSM) products are comprised of either Near Real-Time (NRT), Offline or Data Records (DR) products, which are freely available after user registration at the H SAF data portal. RZSM products are generated fromassimilating the ASCAT-derived surface SM in the ECMWF/H SAF land data assimilation system. Additionally, a hydrological exercise will highlight the added value of soil moisture satellite data for flood prediction. Soil moisture conditions have a great impact on the transformation of precipitation into runoff. A correct estimation of the initial soil moisture condition is a critical aspect for operational flood prediction. In the exercise we will test the sensitivity of flood response to initial soil moisture conditions using a simple hydrological model over an African Basin.
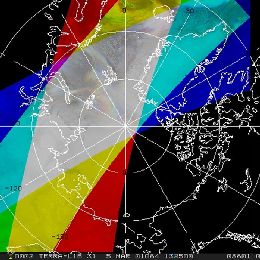
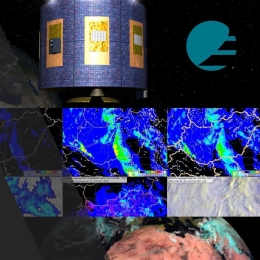
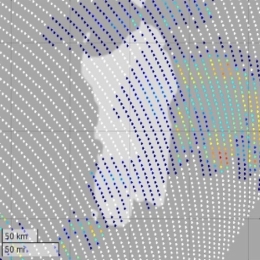
Regis Borde from Eumetsat explains in his presentation how winds are derived from polar orbiting satellites in the Arctic and Antarctic region.
Atmospheric Motion Vectors (AMVs) have been derived from geostationary satellites since late seventies. In 2001, an experimental polar wind product has been developed at the University of Wisconsin-Madison’s (CIMSS) using imagery from MODIS instrument on NASA’s Terra satellite. Filling the lack of observational data over Polar Regions this product demonstrated a global positive impact on the forecast not only over polar areas. Following the initial CIMSS developments, EUMETSAT recently started to extract polar winds from METOP AVHRR instrument. Regis Borde´s session will provide some general information about the current status of polar winds product and about its extraction. The general methodology to derive polar winds from satellite images is mainly based on the heritage used for geostationary satellites, but some specific problems had to be considered due to larger timeliness between consecutive images, to characteristics of the instruments and to specificities of polar areas atmosphere.
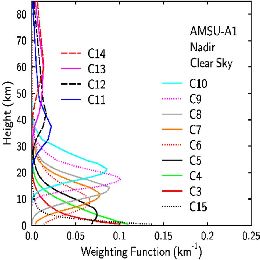
Ralf Bennartz from the University of Wisconsin gives an introduction on the principles of atmospheric soundings with AIRS and AMSU sensors.
High resolution infrared sounders, such as AIRS and IASI, and microwave sounders, such as AMSU, are a key element of the global satellite observing system and provide a wealth of data important for various operational applications including data assimilation and nowcasting applications. This presentation will revisit the physical basis of infrared and microwave sounding and provide an overview on the state-of-the-art of microwave and infrared soundings.
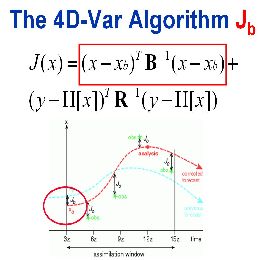
Tony McNally from ECMWF speaks about data assimilation of polar orbiting satellites. He gives an insight into the methods used and accentuates the benefits of satellite data in general for the forecast skills.
This lecture introduces the central role played by data assimilation in Numerical Weather Prediction, Climate Reanalysis and Environmental monitoring. It will be shown that radiance observations from polar orbiting satellites are the single most influential component of the global observing network and the impact of these data on forecast quality will be demonstrated. Finally, the major scientific challenges facing the successful exploitation of satellite radiance observations will be discussed - in particular issues related to vertical resolution, cloud and precipitation contamination and systematic errors.
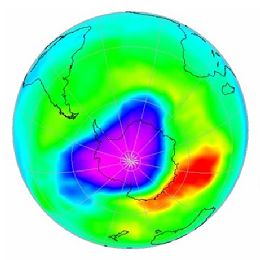
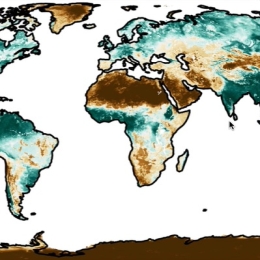
Nan Hao from DLR gives an overview on ozone and other trace gases products from the O3M SAF. The presentation is completed by numerous examples.
This lecture focuses on the ozone and other minor trace gas products, such as NO2 and SO2, from the GOME-2 and IASI instruments on MetOp. These products are developed in the framework of EUMETSAT’s Satellite Application Facility on Ozone and Atmospheric Chemistry Monitoring (O3M-SAF), as part of EUMETSAT’s Polar System (EPS) Ground Segment. The O3M-SAF is responsible for the algorithm development, the operational processing, dissemination and archiving of the products, as well as providing User Services. The ozone and minor trace gas products from GOME-2 and IASI are used in research of atmospheric composition, like ozone loss, dynamics, anthropogenic effects, and in applications of environmental security, like monitoring of volcanic eruptions and pollution.