
Satellite skills and knowledge for operational meteorologist
Listed here are other resources related to Satellite skills and knowledge for operational meteorologist tag:
Note: click on an image to open the Resource

Vinko Šoljan talks about forecasting and nowcasting of deep moist convection, satellite products used, NWP outputs and more.
In this presentation, we will demonstrate the process of forecasting deep moist convection (DMC) at Croatia Control and how satellite products are utilized in this process. This includes large-scale analysis and diagnosis using satellite data, as well as monitoring and nowcasting existing DMC using satellite products and radar data. In DMC forecast we primarily rely on the ingredients-based methodology and NWP guidance.

Andreas Wirth goes over the topic of Dust Infused Baroclinic Storms (DIBS) and explains the current forecast model inconsistencies regarding DIBS as well as their impact on weather.
Dust Infused Baroclinic Storms (DIBS) have a high impact on weather. Mineral dust particles in the atmosphere reduce sunlight at lower levels, reduce visibility and damp daily temperature maxima. Dust particles can have an impact on forecasted precipitation too, and in higher concentrations, dust particles can cause respiratory problems.
This presentation focuses on circulation pattern that causes dust transport towards Europe and on how to detect high dust loads in- and outside clouds from geostationary satellite imagery on the basis of recent examples.
Lecture slides
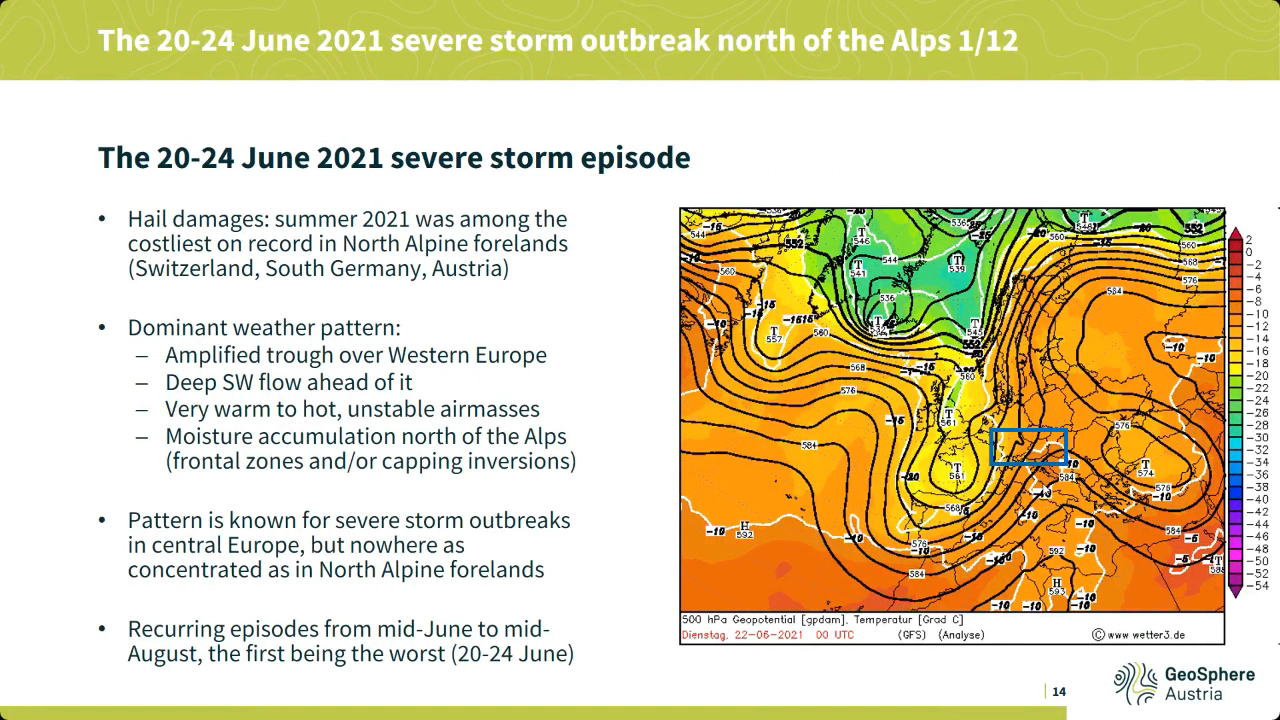
Georg Pistotnik covers the topic of drylines, shows it's relevance in severe weather development.
Drylines are boundaries separating warmer and drier from cooler and moister air, usually resulting from differential diurnal heating and therefore vertical mixing. The most common and distinct dryline in the Alpine region is the boundary between Foehn winds (dynamically driven) and upvalley/upslope circulations (thermally driven). Thunderstorms often form along drylines and intensify when they move onto their moist side, where CAPE and vertical wind shear are systematically enhanced and favor convective organization. This presentation highlights how station and readiosonde data, high-resolution satellite imagery and even webcam images can be integrated into the nowcasting of drylines and resulting thunderstorms, using some prominent cases of the past few years in the eastern Alpine region.
Lecture slides
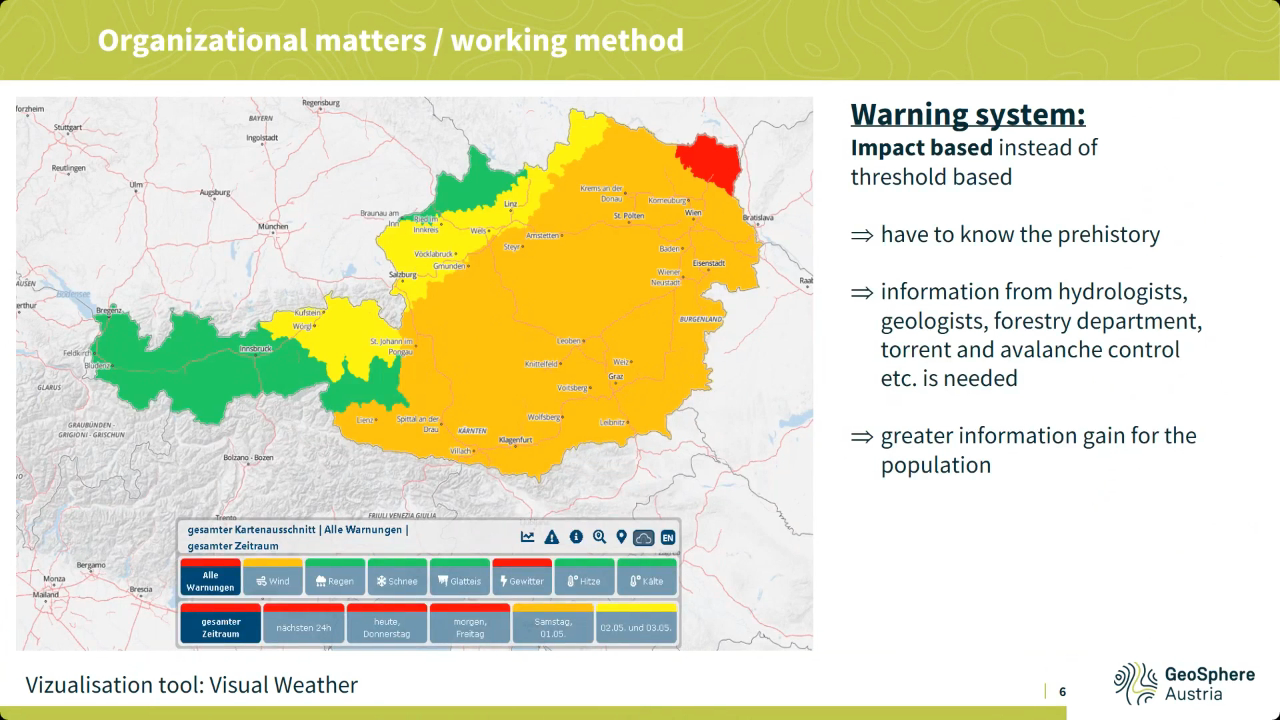
Liliane Hofer speaks about prognostic service of Austria, work organization, regional weather forecast specifics such as southerly föhn winds and others.
Various phenomena, some of which are regionally specific, such as southerly föhn winds or precipitation in northern or southern congestion, make the weather forecast in Austria very challenging at times. In addition, the topographically highly structured landscape also results in quite small-scale differences, for example in inversion weather conditions. All this and special customer products are highlighted in this presentation, as well as the basic working environment of the forecasters and, of course, the satellite products used for this purpose.
Lecture slides
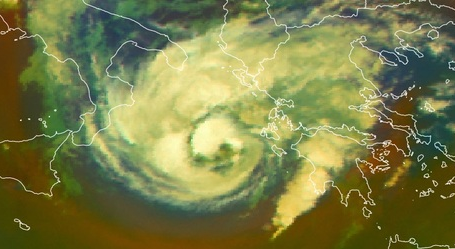
A new conceptual model on Mediterranean hurricanes - "Medicanes".
Medicanes are rare, intense and destructive warm-core cyclones occasionally generated in Mediterranean Basin.
Compared with tropical cyclones, medicanes are weaker and smaller in size, with diameters under 300 km, while the diameter of a hurricane is larger than 1000 km. Hurricanes move in general from east to west due to easterly winds, while medicanes generally (but not always) move from west to east due to the mid-latitude westerlies.
Medicanes mostly occur in the western Mediterranean and in the region extending from the Ionian Sea to the North African coast. There is strong variability from year to year without any significant trends.
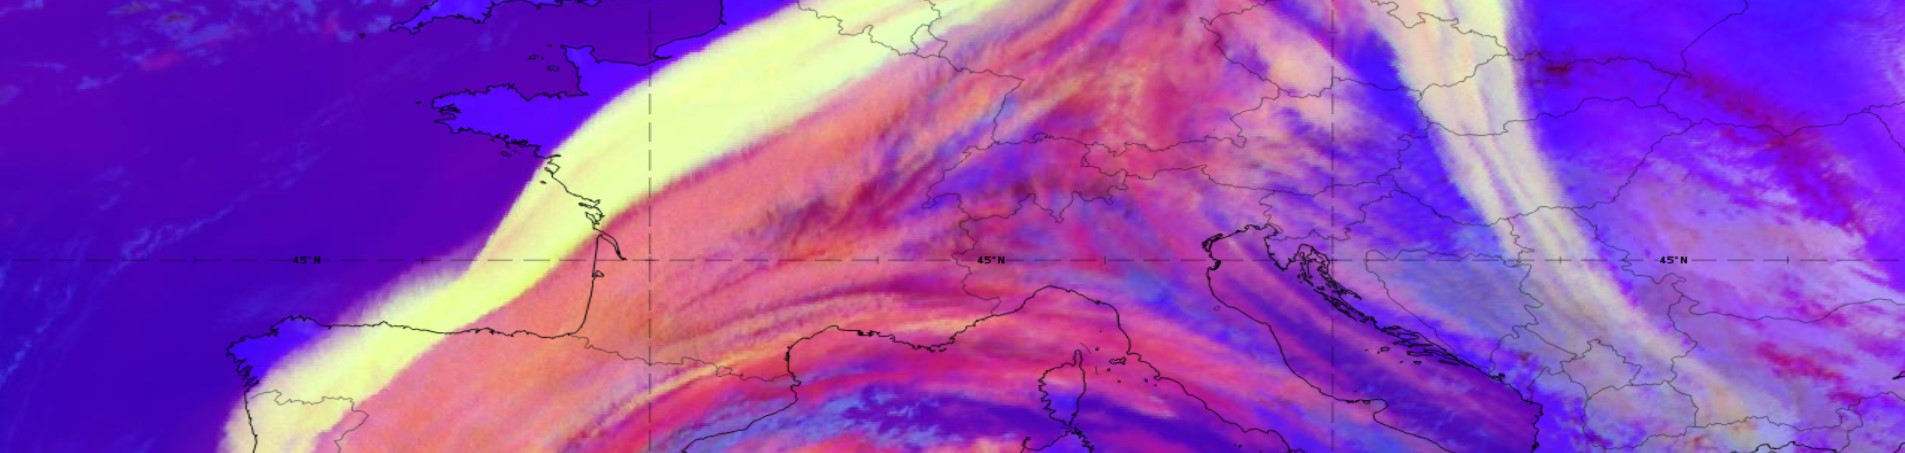
A conceptual model on DIBS: A special kind of Cirrus clouds formed by dust
The strongest influence of DIBS, and especially of dusty cirrus, on surface weather is mainly the reduced solar radiation reaching the ground as dust particles act as condensation nuclei and form clouds where otherwise no clouds would have been present. As current numerical weather prediction models do not accurately account for microphysical cloud formation processes caused by the additional dust at higher atmospheric levels, predicted maximum temperatures often have a considerable bias towards higher values.
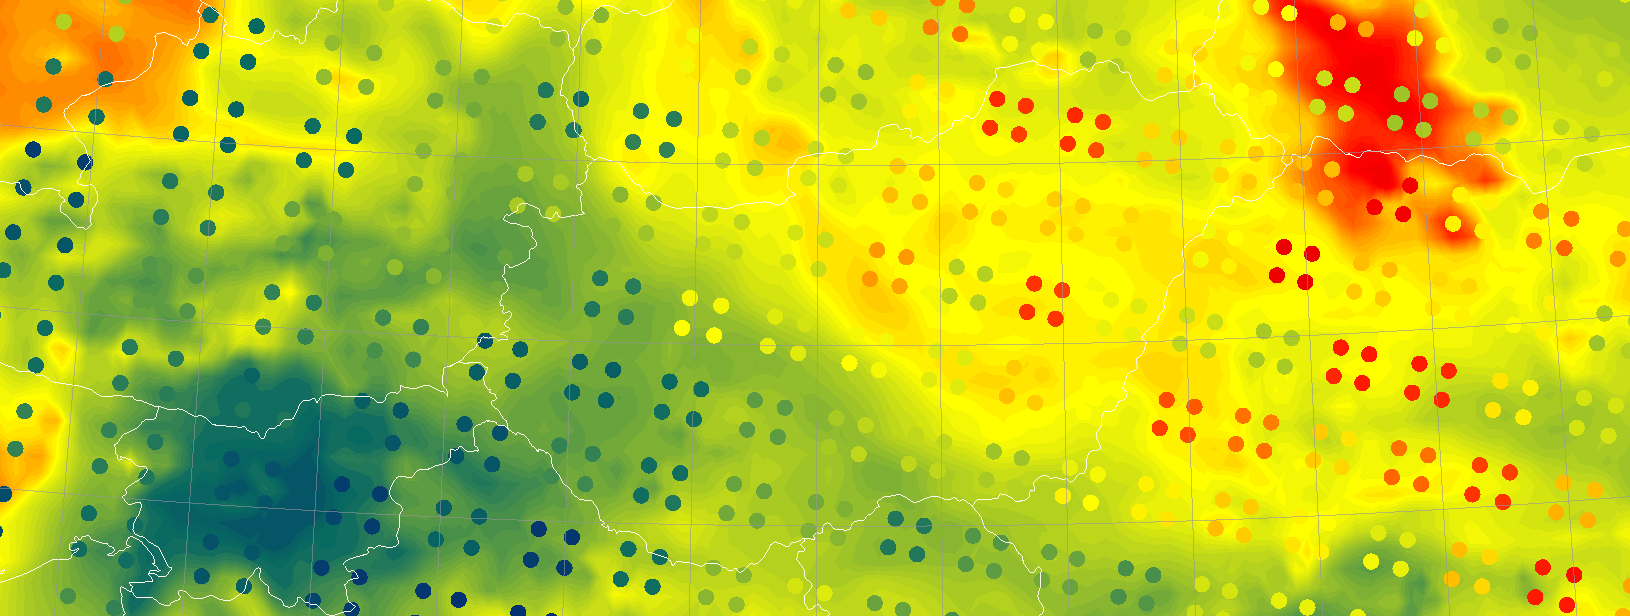
Case Study of the pre-convective environment of 19th May 2021 using IASI sounder data.
This Case Study of the pre-convective environment of 19th May 2021 using IASI sounder data focuses on exploring how the use of IASI retrievals added additional value to the forecast of the incoming storm over Hungary.
Carla Barroso talks about the EUMETSAT Jupyter Notebooks for MTG and how to use them.
To prepare users for the data from the MTG (Meteosat Third Generation) mission instruments, in particular the Flexible Combined Imager (FCI) and the Lightning Imager (LI), EUMETSAT has developed a series of Jupyter notebooks designed to demonstrate the capabilities of MTG instruments for weather applications. Some of these notebooks use proxy data from sources such as MODIS and GLM to allow users to familiarise themselves with the expected capabilities of MTG instruments, and there is a specific notebook focused on familiarising users with the FCI data format. These notebooks are available in the EUMETSAT GitLab repository https://gitlab.eumetsat.int/.
Lecture slides
Martin Raspaud dives into what Pytroll is, how to use it and how to contribute to the project.
Developed jointly by professional software developers and experts in the remote sensing field, pytroll is a collection of free and open source python library for working with remotely sensed earth-observation data. MTG-I1, with its novel instruments, brings new information at a higher temporal and spatial resolution. While this is a challenge for data exploitation, the Pytroll team has been working hard to support the new data formats to allow working seamlessly with the new data and providing it with standard tools, both when working locally or in the cloud. Having EUMETSAT experts involved ensures state-of-the-art quality of the data. In this presentation, we will show how pytroll works and how it can be used for the exploitation of the MTG-I1 data as a seamless continuation of SEVIRI, both in operations and research.
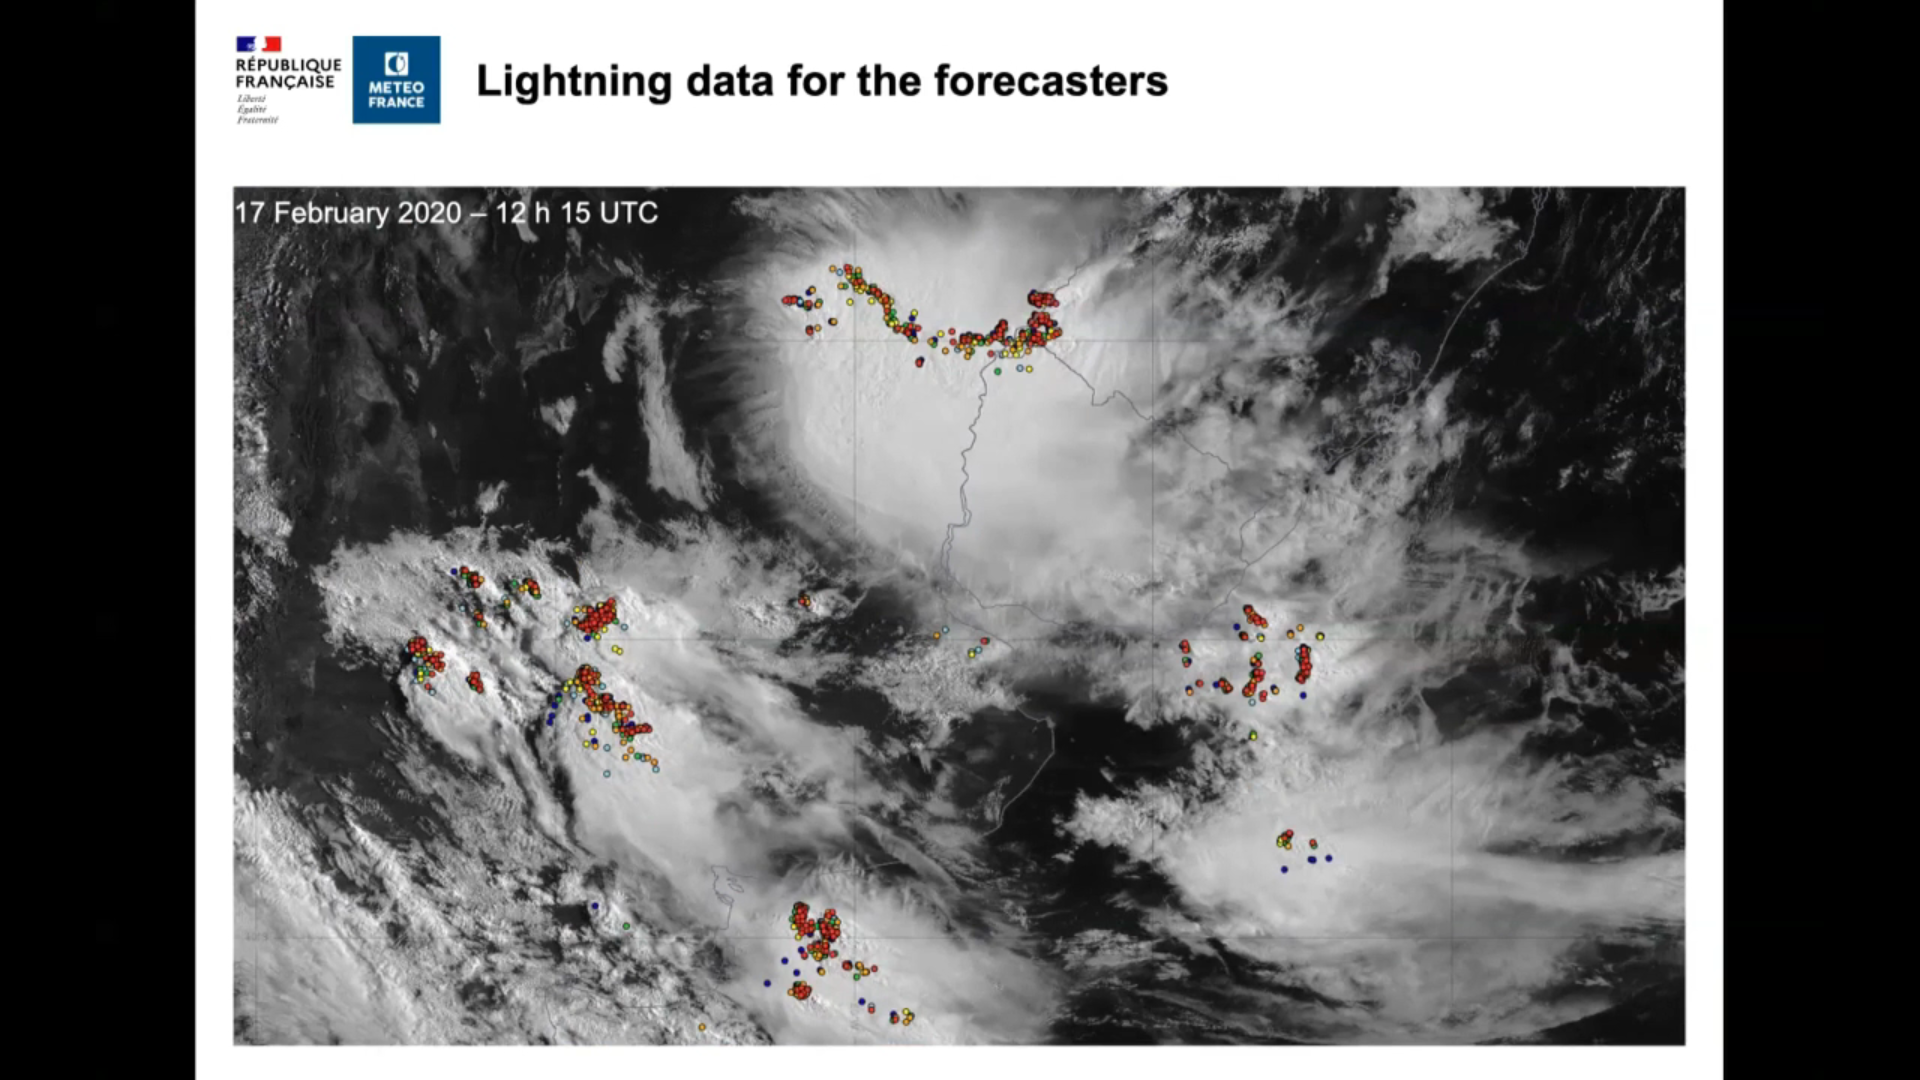
Sylvain Le Moal talks about use of lightning data at Meteo France.
Meteo-France already has experience processing data for French overseas territories from next-generation satellites currently in operation, such as United States’ geostationary satellites. The Goes series weather satellites (Goes-16, -17 and -18), and the on-board Geostationary Lightning Mapper (GLM), have now been operational for several years. The GLM detects and maps total lightning – in-cloud, cloud-to-cloud, and cloudto-ground – continuously over the Americas and adjacent ocean regions. The performance of the GLM, the application and use of its data can be produced for forecasters, medias, and numerical weather prediction models.
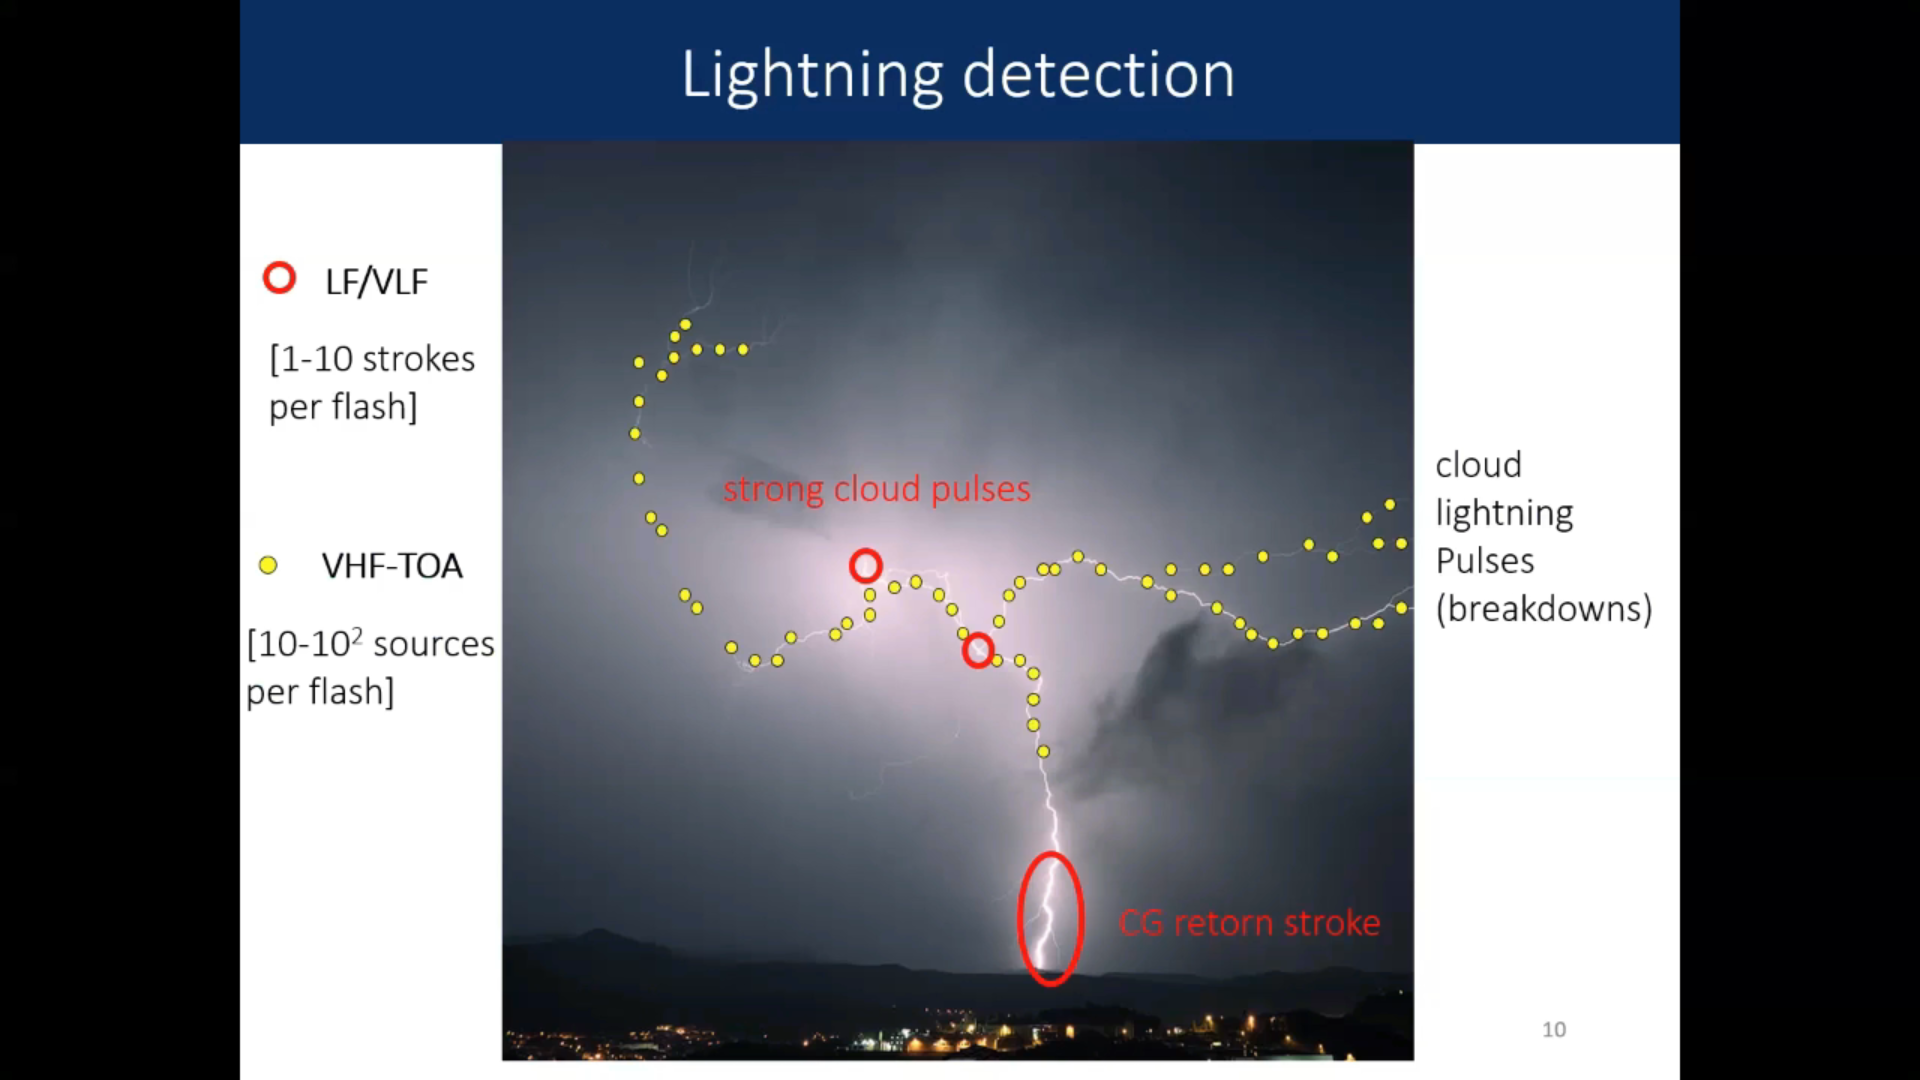
Jos de Laat talks about the way KNMI applies GLM data.
About five years ago KNMI started its first exploratory steps towards working with American NOAA/GOESGLM data. Originally initiated as a way to prepare for the MTG-LI mission, the activities naturally developed, expanded while perspectives broadened. I will discuss this path from the first exploratory steps all the way to where we currently are and the – sometimes unexpected – spin-off activities. These include:
• volcano: early warning, KNMI GEOWEB and the BES dashboard
• operational monitoring: data exploration/handling/visualization
• near-real-time probabilistic lightning prediction: artificial intelligence
• airport: auto-METAR
• network activities
As KNMI is very much a hybrid institute build around operational weather forecasting on the one hand and scientific geophysical research on the other hand there are some interesting observations and lessons I have learned that I will share at the end of the presentation.
Nicolau Pineda talks about the new LI and comparison between ground based and satellite based lightning measurements.
The Meteosat Third Generation Lightning Imager (MTG-LI) is now providing continuous optical observations from the lightning occurring in Europe and Africa. Prior to the MTG-LI, the Lightning Imaging Sensor (LIS) onboard the International Space Station (ISS) offered a unique opportunity helping to prepare for the MTG-LI, since it has a similar detection principle. Whereas optical imagers like the ISS-LIS or and the MTG-LI use a narrow spectral infrared emission (777.4 nm) associated with hot lightning intra-cloud channels, commercial ground-based Lightning Location Systems (LLS) detect radio emissions in the low / very low frequency range to locate cloud-to-ground lightning. Therefore, differences between sensors and location techniques must be kept in mind when comparing lightning measurements from different systems. In this regard, the Lightning Mapping Array (LMA), which mostly detects intra-cloud discharges in the VHF range, is best suited for CalibrationValidation purposes.