
Satellite skills and knowledge for operational meteorologist
Listed here are other resources related to Satellite skills and knowledge for operational meteorologist tag:
Note: click on an image to open the Resource
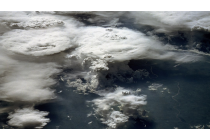
Deduce cloud top heights based on brightness temperatures, surface observations and sounding data.
In this part of the course you will not only learn more about the identification of clouds such as Stratus, Cumulus and Cirrus from satellite images, and you will also discover various methods to derive cloud height information. Microphysical properties of clouds like cloud phase and cloud particle size are also addressed.
To access the resource click here.
Note: all resources are provided as an external link which redirects you to https://eumetcal.eu where you will need to create a user account in order to gain access to the course
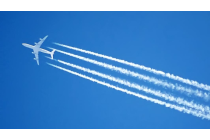
Identify contrails and ship trails.
In this part of the course you will not only learn more about the identification of clouds such as Stratus, Cumulus and Cirrus from satellite images, and you will also discover various methods to derive cloud height information. Microphysical properties of clouds like cloud phase and cloud particle size are also addressed.
To access the resource click here.
Note: all resources are provided as an external link which redirects you to https://eumetcal.eu where you will need to create a user account in order to gain access to the course
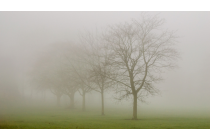
Identify fogs and discriminate between fog and low cloud.
In this part of the course you will not only learn more about the identification of clouds such as Stratus, Cumulus and Cirrus from satellite images, and you will also discover various methods to derive cloud height information. Microphysical properties of clouds like cloud phase and cloud particle size are also addressed.
To access the resource click here.
Note: all resources are provided as an external link which redirects you to https://eumetcal.eu where you will need to create a user account in order to gain access to the course
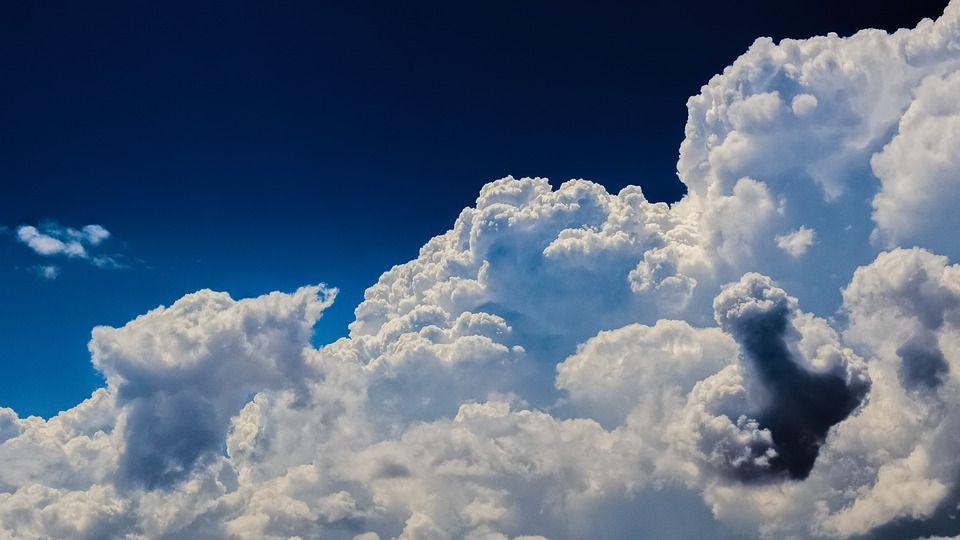
Identify cumulonimbus clouds and their characteristics.
In this part of the course you will not only learn more about the identification of clouds such as Stratus, Cumulus and Cirrus from satellite images, and you will also discover various methods to derive cloud height information. Microphysical properties of clouds like cloud phase and cloud particle size are also addressed.
To access the resource click here.
Note: all resources are provided as an external link which redirects you to https://eumetcal.eu where you will need to create a user account in order to gain access to the course
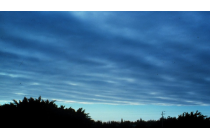
Identify stratiform, cumuliform and cirriform cloud regions and individual cloud forms and their characteristics.
In this part of the course you will not only learn more about the identification of clouds such as Stratus, Cumulus and Cirrus from satellite images, and you will also discover various methods to derive cloud height information. Microphysical properties of clouds like cloud phase and cloud particle size are also addressed.
To access the resource click here.
Note: all resources are provided as an external link which redirects you to https://eumetcal.eu where you will need to create a user account in order to gain access to the course
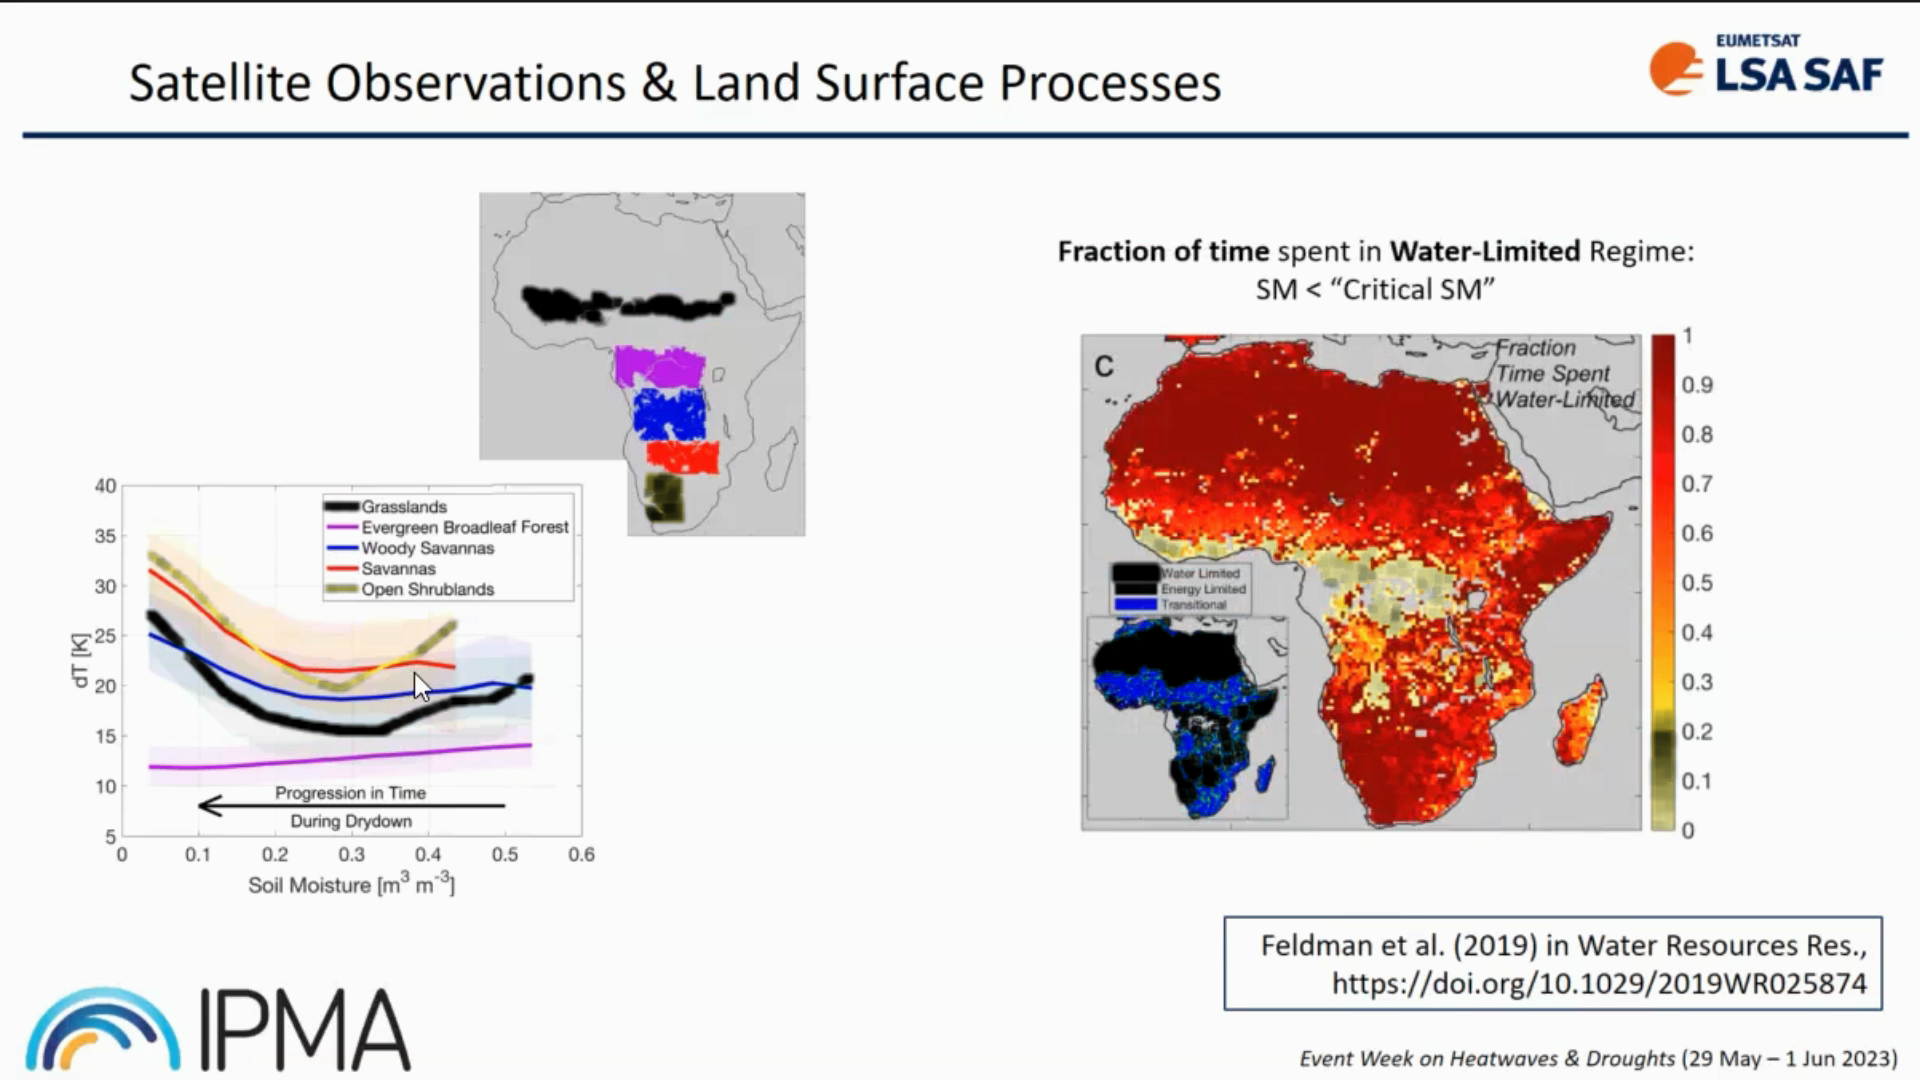
Isabel Trigo provides insight into LSA SAF datasets and its usage.
Heat and water stress leave clear signatures on land surface variables that can be monitored from space. The LSA SAF has been providing satellite datasets and products that allow the characterization of the surface energy budget and the monitoring of vegetation growth and stress. We will show that the combination of information on the surface temperature diurnal cycle and on vegetation state provides a different perspective on the spatial extent and time evolution of droughts and heatwaves, and reveals underlying soil vegetation-atmosphere feedbacks.
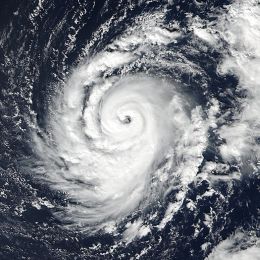
This case study describes the evolution and the life cycle of hurricanes in general and the evolution of hurricane Ophelia (2017) in particular.
This module and the adjoined simulator treat the hurricane Ophelia that threatened Europe in 2017 and hit the coast of Ireland in October that year.
In this module, you will learn more about hurricanes in general and about the evolution of Ophelia in particular from the very beginning over the Atlantic until its final stage over Ireland.
In the adjoined simulator, you will forecast the warnings related to hurricane Ophelia and the dangers that arose with this weather situation.
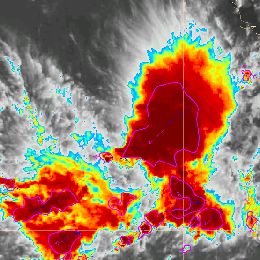
Jean-Marc Moisselin and Frédéric Autones talk about rapidly developing thunderstorms (RDT and applications available for forecasting them.
RDT-CW (Rapid Development Thunderstorm Convection Warning) product is an object-oriented diagnostic for convective clouds or cells. RDT-CW is mainly based on satellite data. RDT-CW software tracks clouds, identifies those that are convective (discrimination), and provides some descriptive attributes for their dynamics. Year after year many attributes have been added to the convection object. These improvements offer end-users the possibility to focus on specific parameters according to their center of interest: dynamic of the system (cooling rate, motion vector) lightning activity, rainfall, main cloud phase of the cell, etc. These attributes may come from various sources such as NWP data, other PGEs (Product Generation Element), lightning network. In the v2013 release, an overshooting top detection inside RDT cell is proposed to users. This new attribute allows to focus on potentially hazardous areas.
In the future releases the description of convective cells will be enriched, giving a high priority to the use of other SAFNWC products. A nowcast of RDT up to one hour will be implemented.
Several SAFNWC processing chains are implemented at Meteo-France over various geographical areas: those covered by MSG of course, but also those covered by other geostationary satellites, like overseas territory where Meteo-France centers are still implemented. Forecasters in these centers are the main users to benefit from RDT as an additional product. Productions over Europe and Africa benefit to Aeronautical forecasters from Meteo-France’s National Forecast center, to French Army, and also to ACMAD, Niamey.
A target visualization tool with nowcasting capabilities will be presented, which allows taking advantage from RDT end-product. Presentation of RDT for various situations and over various areas will also be undertaken, and the latest development implemented in v2013 release will be highlighted.
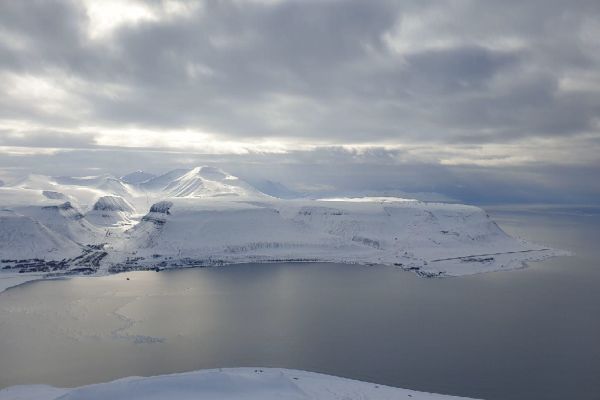
Ine-Therese Pedersen speaks about difficulties of forecasting icing in the far north.
Weather forecasting in the Arctic is challenging, and the further north you go, the more difficult it can be to meet this challenge. Svalbard is situated between 74-80 degrees north and consists of several islands with high mountains, deep fjords, and large glaciers. The terrain makes it even harder to model and forecast the weather. In addition to cold, snowy weather in wintertime, one of the large challenges is icing in autumn and winter. This has an impact on both roads, animal living conditions, and air traffic. This talk will go deeper into icing in relation to air traffic on Svalbard, mostly connected to the main airport, Svalbard Airport, situated near Longyearbyen."
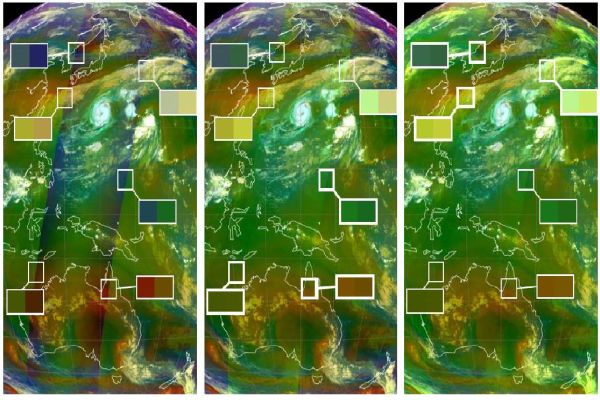
Juuso Paajanen presents the difficulties of using geostationary satellite data in high latitudes.
Parallax shift, Limb cooling, Low sun elevation angle are some of the issues associated with mainly geostationary satellites in the high-latitudes. Some satellite images are shown to demonstrate these issues. Some solutions are suggested here for countering these problems.
This presentation talks about Example of the tools we are using in our operational work.
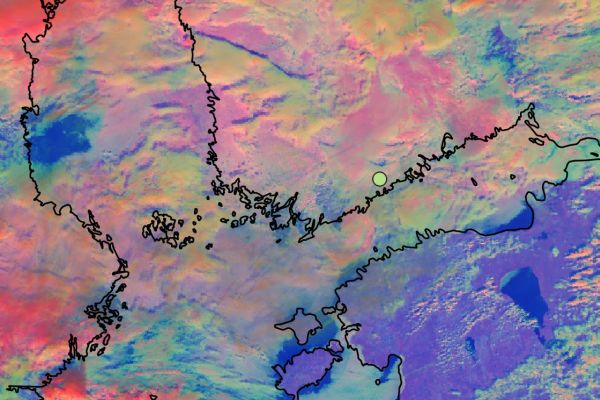
Pia Isolahtenmaki (stepping in for Robert Makitie) presents how FCI proxy data help in differentiating cloud types in low-cloud conditions.
On the 11th of September an almost stationary frontal system occurred over southern Finland leading to development of a large fog cloud over the Gulf of Finland and the Baltic Sea. The fog later moved slowly over southern Finland, where Finland’s busiest airport, Helsinki-Vantaa airport, is located. The fog cloud that occurred over the Gulf of Finland was hard to spot from SEVIRI images due to different layers of middle and high clouds. When thinking about the future, the question arises, would the FCI have spotted something more in this situation?
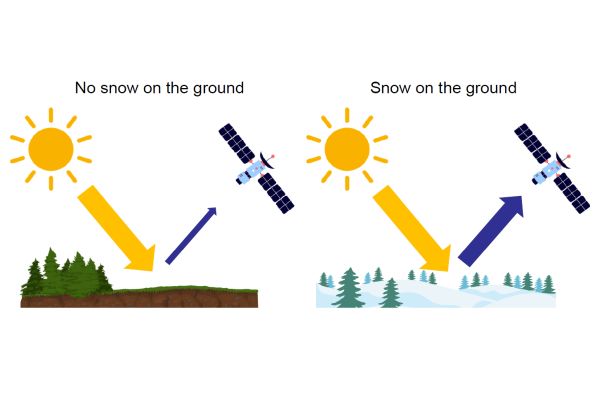
Kerttu shows how the snow and ice cover change during decades according to satellite data.
Snow and ice cover of the Northern Hemisphere (NH) are major factors in the global climate system.
Due to the large area and sparse in situ measurements, snow and ice cover monitoring at the continental scale is only possible from satellites. Estimating snow and ice cover at large scale is important for hydrological and climatological applications. As they greatly influence the entire climate system, changes in snow and ice cover will affect the surface energy balance, which in turn makes snow and ice cover important inputs for climate models.
Snow and ice cover in the Arctic are changing. There is a negative trend in the surface albedo due to negative trends in snow and ice cover. The extent and duration of snow and ice cover are decreasing, and the changes are most prominent in spring due to the strong surface albedo feedback. Snow water equivalent (SWE) also shows negative trends globally, but significant spatial variability exists especially in the Arctic.