Questions and Answers
Question
Please, check the areas in Figure 2 and answer the question:
Where you would expect thunderstorm initiation?
 Figure 2: 24 hour Microphysics RGB data for 22 July 2010 08:55 UTC
Thunderstorms are most likely in areas 1, 2, 8 and 9.
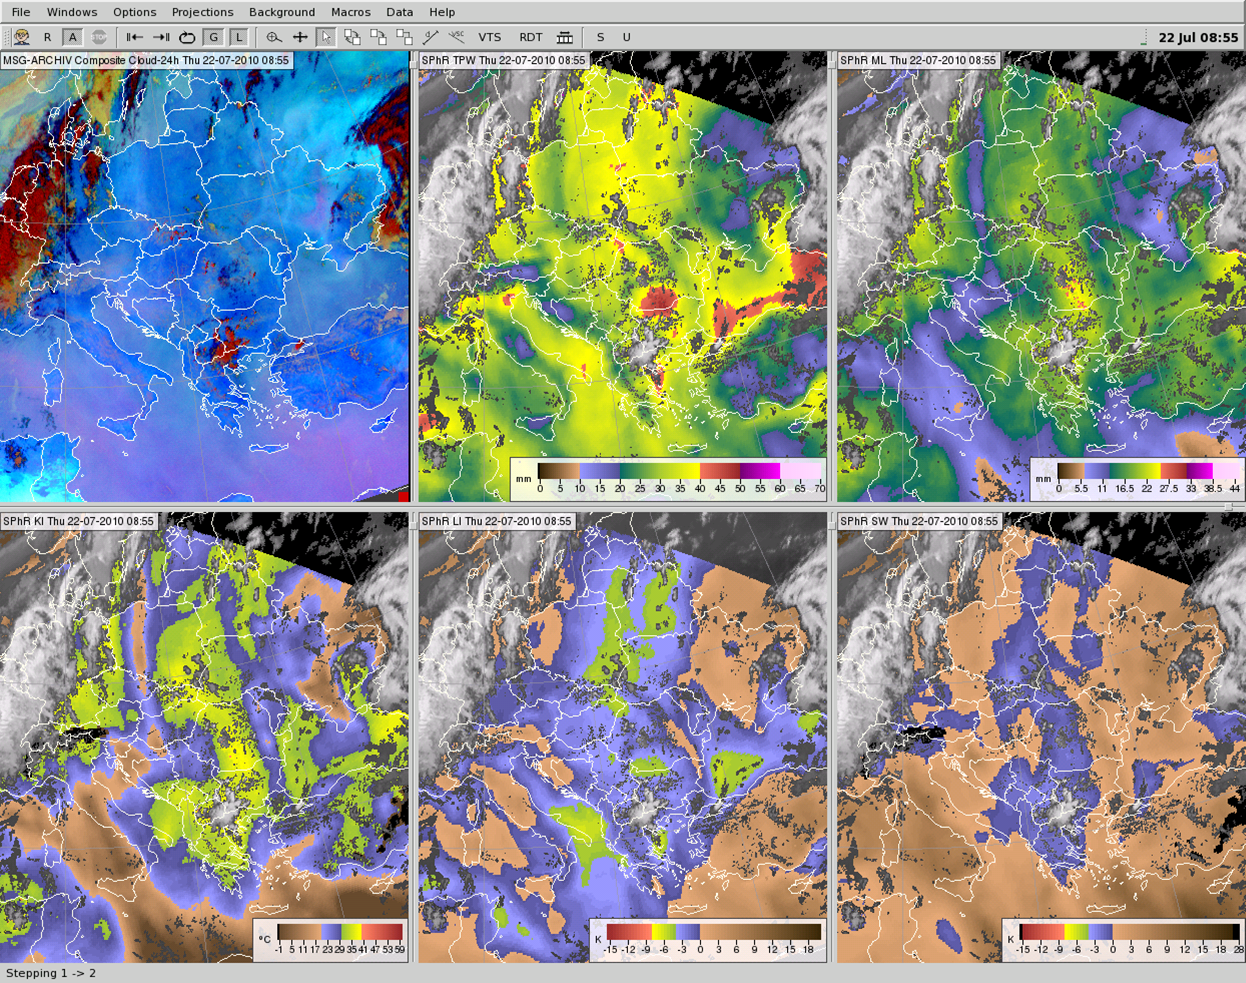
After answering the questions, have a look at the satellite images and SPhR products between 2:55 and 17:55 UTC to see what actually happened that day.
![]()
 Animation 3: Press the orrange button above the image to see the animation on July 22nd 2010, from 2:55 to 8:55 UTC
For further explanation please refer to the picture below. If you click on the numbers you will get detailed explanations for each area.
Figure 3: Click on each city to see a detailed explanation of situation.