Statistics on environmental parameters
This section presents statistics on analysing convective environmental parameters (Putsay et al., 2013). The data comes from studies of 71 severe and non-severe convective events in or near the Carpathian Basin. SPhR products close to the location of the convection at the time of its initiation were collected. The environmental parameters of different storm intensities were studied. (The data used to assess storm intensity is summarized in Appendix A.3.) We worked only with satellite-retrieved instability and water vapor content values. We did not study the wind field, e.g. wind shear, although it is very important for the formation and development processes of severe storms.
We calculated ML/TPW ratios, which are measure of the relative dryness of the mid-layer. Dry mid-layers can often cause strong downdrafts. Figs. 1, 2 and 3 show the relations between the ML/TPW ratio and different values of K-index, TPW and lifted index, respectively. The symbols indicate the intensity class of the convective events.
In Figs. 1 and 2 the symbols of severe storms are grouped in the lower right corner of the graph. The graphs show that the studied severe storms formed in environments where K-index values were above 28 °C, lifted index values less than -1 °C, TPW higher than 23 mm and ML/TPW lower than 0.55. Note that these thresholds are valid only for relatively low altitudes. Over mountainous terrain, TPW decreases with altitude, and ML/TPW increases as a consequence.
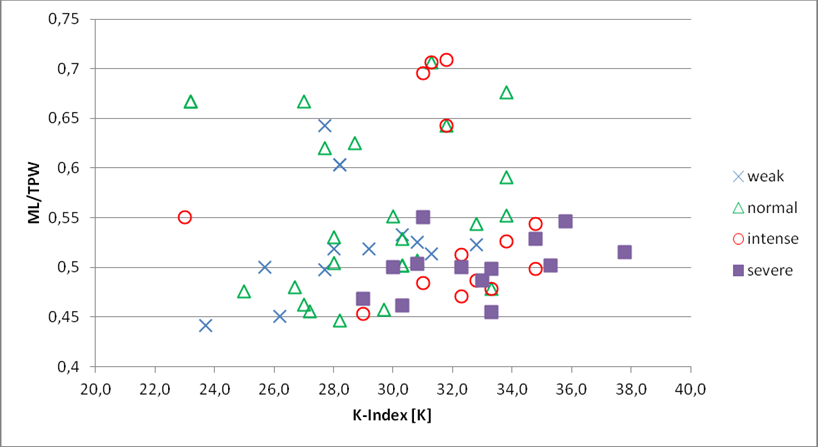 Figure 1: The relation between the ML/TPW and K-Index values for convective events of different intensity classes
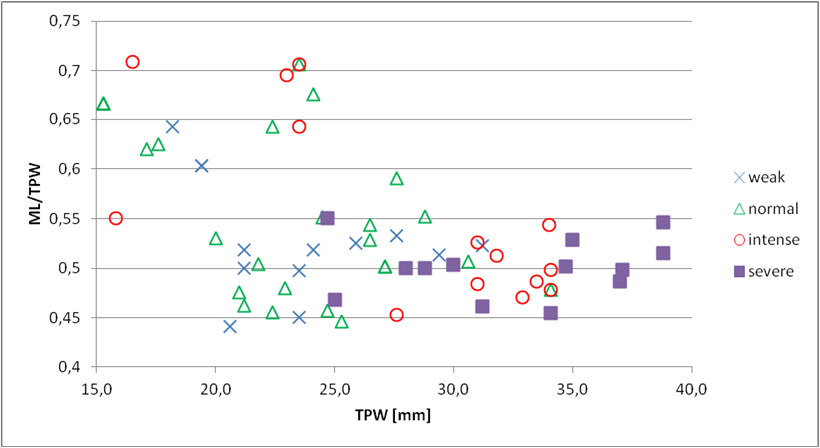 Figure 2: The relation between the ML/TPW and TPW for convective events of different intensity classes
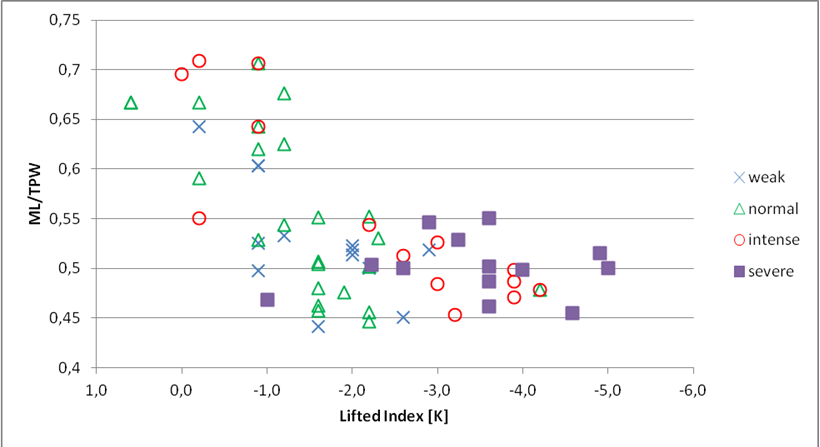 Figure 3: The relation between the ML/TPW and Lifted Index values for convective events of different intensity classes
Figs. 4, 5 and 6 show the relation between the ML/TPW ratio and the K-index, TPW and lifted index, respectively, the symbols indicating the altitude range where initiation took place. The symbols belonging to different altitude ranges are more or less mixed. The above 800 m altitude class is most clearly separated from the others.
In Fig. 5, instances of the above 800 m class are grouped in the upper left corner of the graph, showing that TPW is low and ML/TPW high over elevated terrain. The pattern in Fig. 6 resembles the one in Fig. 5, showing that the lifted index is around zero over elevated terrain. It can be slightly positive, as already mentioned in Section Stability indices in Chapter V, or it can be negative. However, no lifted index values below -1.2 K were found in this altitude range.
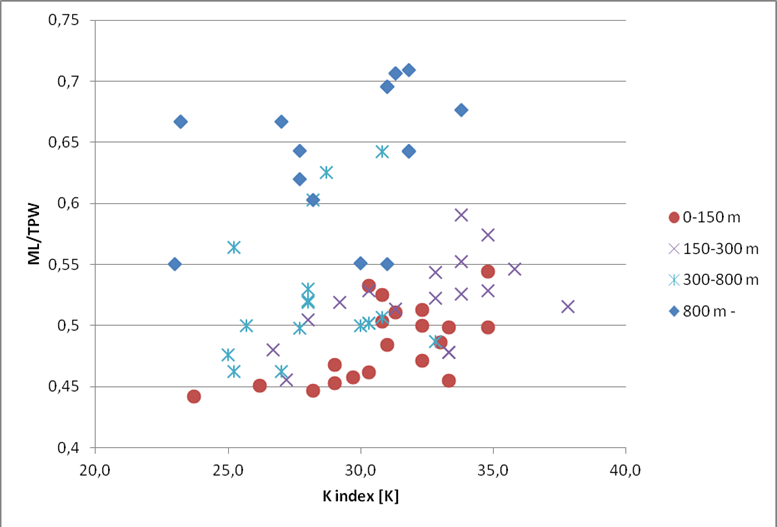 Figure 4: Relation between the ML/TPW ratio and K-Index for convective events in different altitude ranges in the convection's area of initiation.
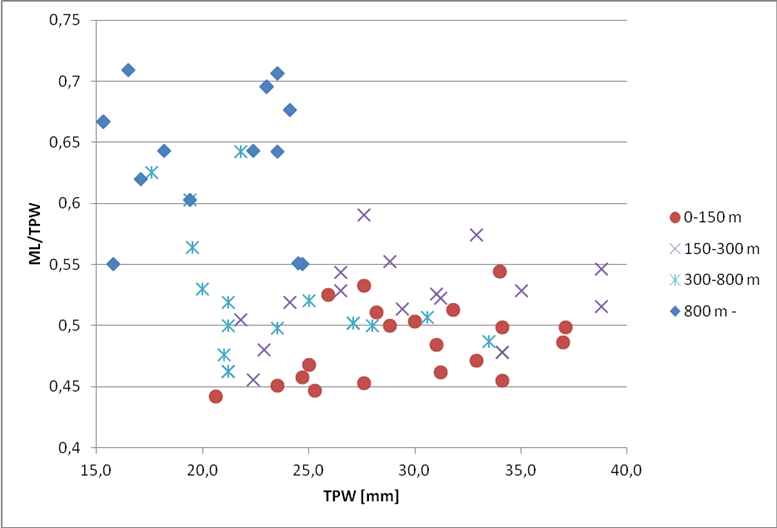 Figure 5: Relation between the ML/TPW ratio and TPW for convective events in different altitude ranges in the convection's area of initiation.
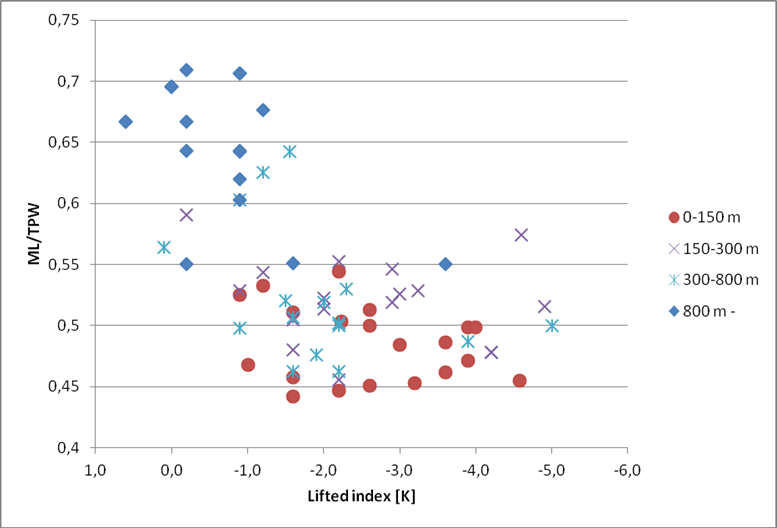 Figure 6: Relation between the ML/TPW ratio and Lifted Index for convective events in different altitude ranges in the convection's area of initiation.