Available data and products
The following figures show the 24 hour Microphysics RGB image and SPhR products for 22 July 2010, 2:55, 5:55 and 8:55 UTC.
![]()
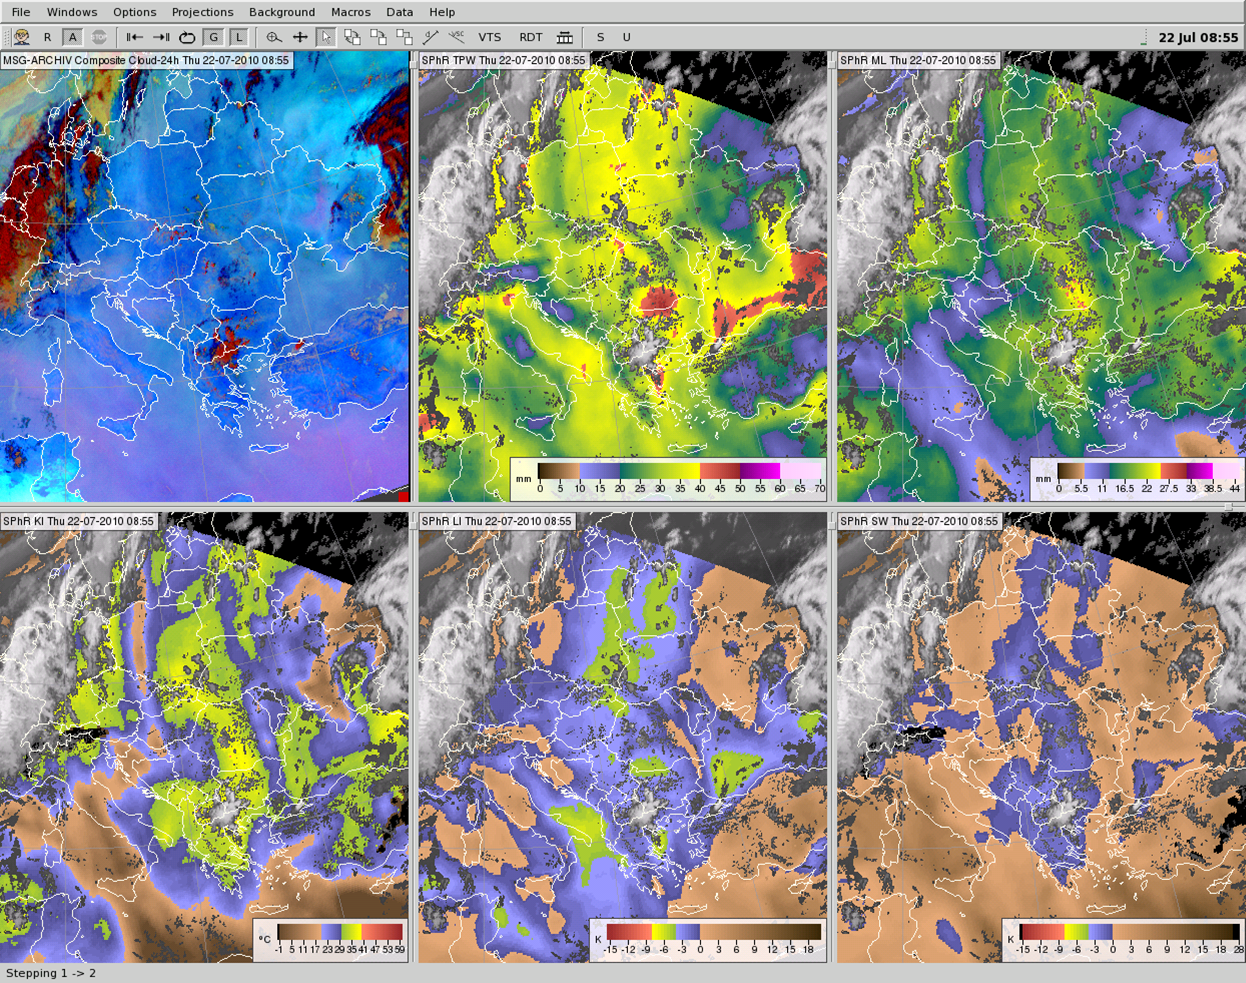 Animation 1: Please press the orange play button to see 3-hourly satellite imagery on July 22nd 2010, from 2:55 to 8:55 UTC
You will be asked the following questions about these areas: Where would you expect thunderstorms to initiate? Before answering you may also look at the surface charts from 00, 06, 12 and 18 UTC, as well as the 12 UTC radiosonde measurements from some stations.
![]()
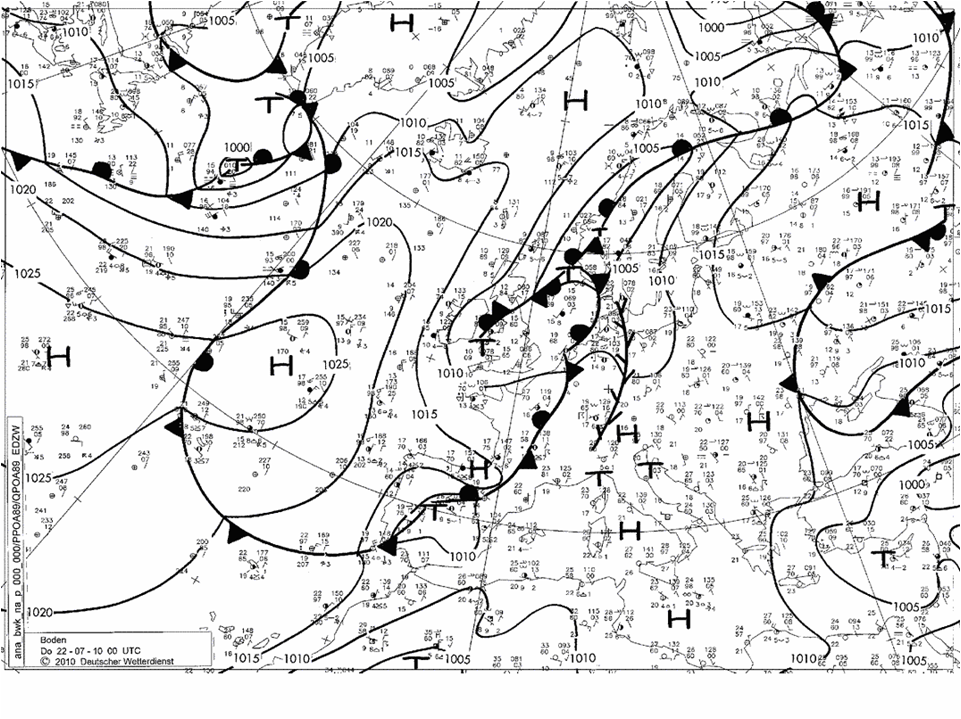 Animation 2: Please press the orange play button to see surface chart maps for 22 July 2010, from 00 to 18 UTC.
You may look at the 12 UTC radiosonde measurements from the sounding stations indicated by yellow circles on Figure 1.
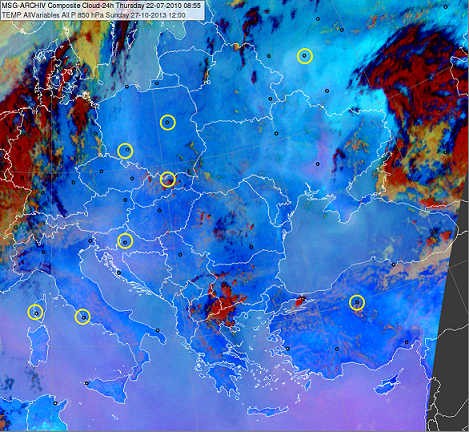 Figure 1: Avaliable radiosonde measurements at 12 UTC. Klick on the circles to see the radiosonde measurements.