Patterns of mid- and upper tropospheric dryness
The 6.2 and 7.3 µm water vapour channels of the METEOSAT-9 satellite provide observational evidence of dry air in the upper and mid-levels of the troposphere. The satellite imagery was combined with relative humidity fields from the ECMWF model (Fig. 2.6). Dark stripes in the water vapour images seem to be closely related to areas of dry air in the ECMWF forecasts for 400 and 600 hPa, respectively. The environmental dryness at the 600 hPa level (relative humidity well below 30 %) might be important because it is often expected (e.g. by computation of the Downdraft Convective Available Potential Energy, DCAPE) that thunderstorm downdrafts initiate at this height.
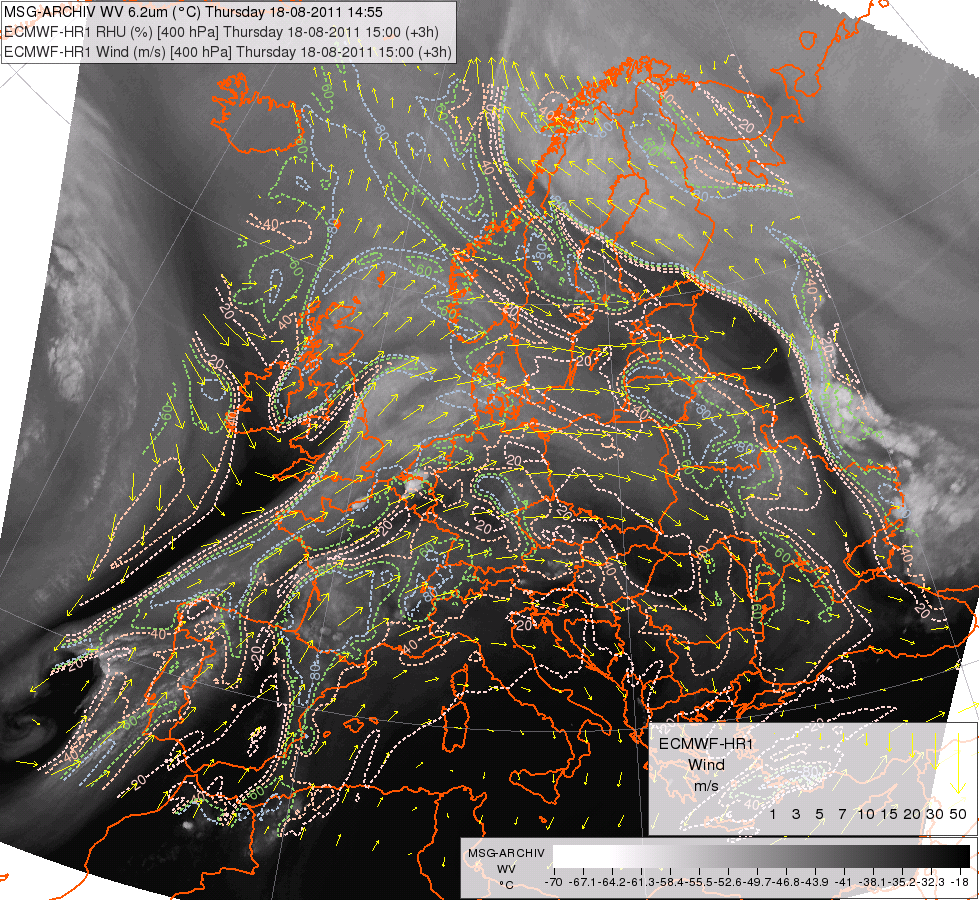
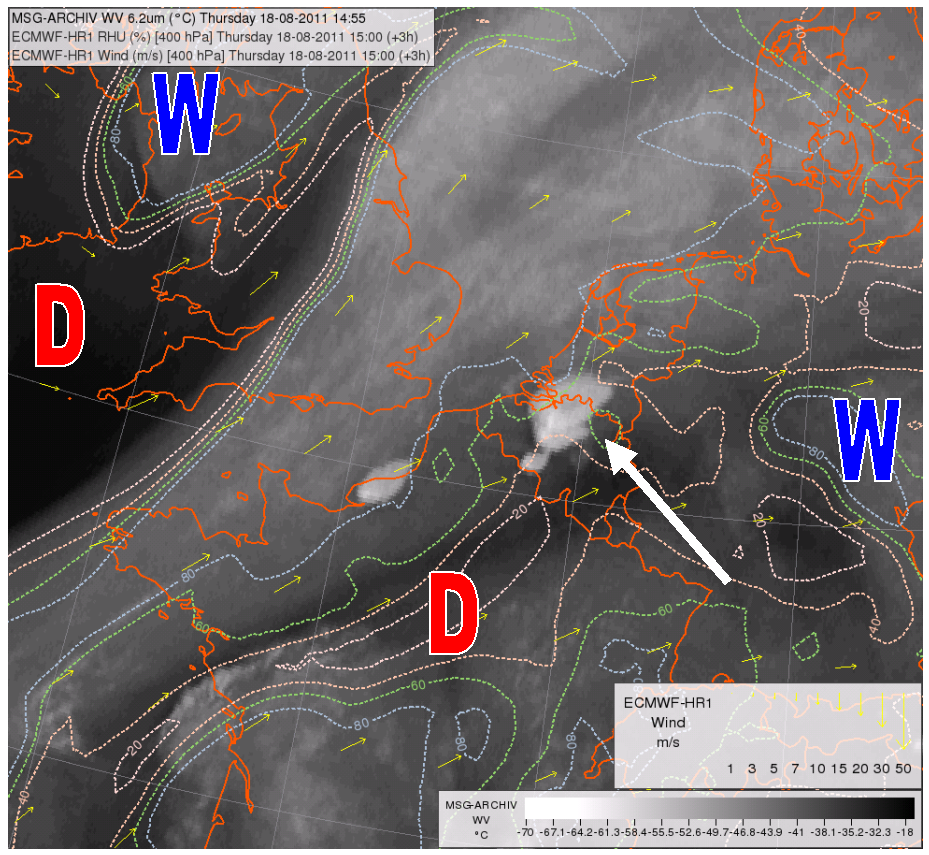
Fig. 2.6a. Meteosat-9 WV6.2 image for 14:55 UTC overlaid by 3 hour ECMWF forecast for 15 UTC: relative humidity (colored dashed lines) and wind (arrows) at 400 hPa for the whole of Europe (left) and in a close-up look (right). The areas with relative humidity exceeding 80 % and below 20 % are shown by the letters W and D, respectively. The arrow indicates the location of Hasselt.


Fig. 26b. Meteosat-9 WV7.3 image for 14:55 UTC overlaid by 3 hour ECMWF forecast for 15 UTC: relative humidity (colored dashed lines) and wind (arrows) at 600 hPa for the whole of Europe (left) and in a close-up look (right). The areas with relative humidity exceeding 80 % and below 20 % are shown by the letters W and D, respectively. The arrow indicates the location of Hasselt.