
yellow
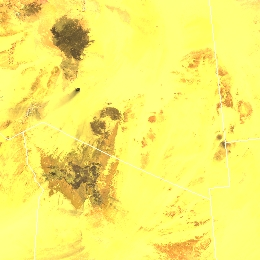
Sandy desert appears yellow in Cloud Phase RGB. Rocky desert appears yellow with brownish or reddish shades, or grey.
In the figures below, the Cloud Phase RGB is presented together with the Natural Colour RGB to help identifying the surface features.

Fig. 1: VIIRS Cloud Phase and Natural Colour RGB images for 27 April 2021, 12:10 UTC
Figure 1 shows the part of the Sahara with the Sinai Peninsula. The Sahara Desert appears mostly yellow, while the vegetated area (e.g. along the Nile River and the delta of the Nile) appears dark/medium brown in the Cloud Phase RGB.
In the Natural Colour RGB (right image), the Sahara shows a special structure: sandy desert appears pinkish red, other areas (rocky or mixed desert) appear brownish or grey. On the Cloud Phase RGB one can see almost the same structure. Sandy desert appears yellow, while rocky or sand mixed with stones appear darker with some brownish or reddish shades. However, the Cloud Phase RGB shows less details than the Natural Colour RGB. The reason for this is that the Cloud Phase RGB is tuned for highlighting cloud top microphysical features and not for surface features. The red and the green beam of the Cloud Phase RGB are cut at 50% reflectivity values, (see the recipe on the left) resulting colour saturation for some areas of the desert and hence omitting surface details.
Figure 2 below shows the north-western coast of the Black Sea in June and August. The ‘Oleshky Sands’ national park is located close to the River Dnieper (indicated by a white arrow). It consists of sand dunes with sparse vegetation across the sands. In the Cloud Phase RGB, the desert appears yellow with some brownish shades in June and August (slightly more brownish shades in June than in August). Note that a salt lake is also seen (indicated by a blue arrow).
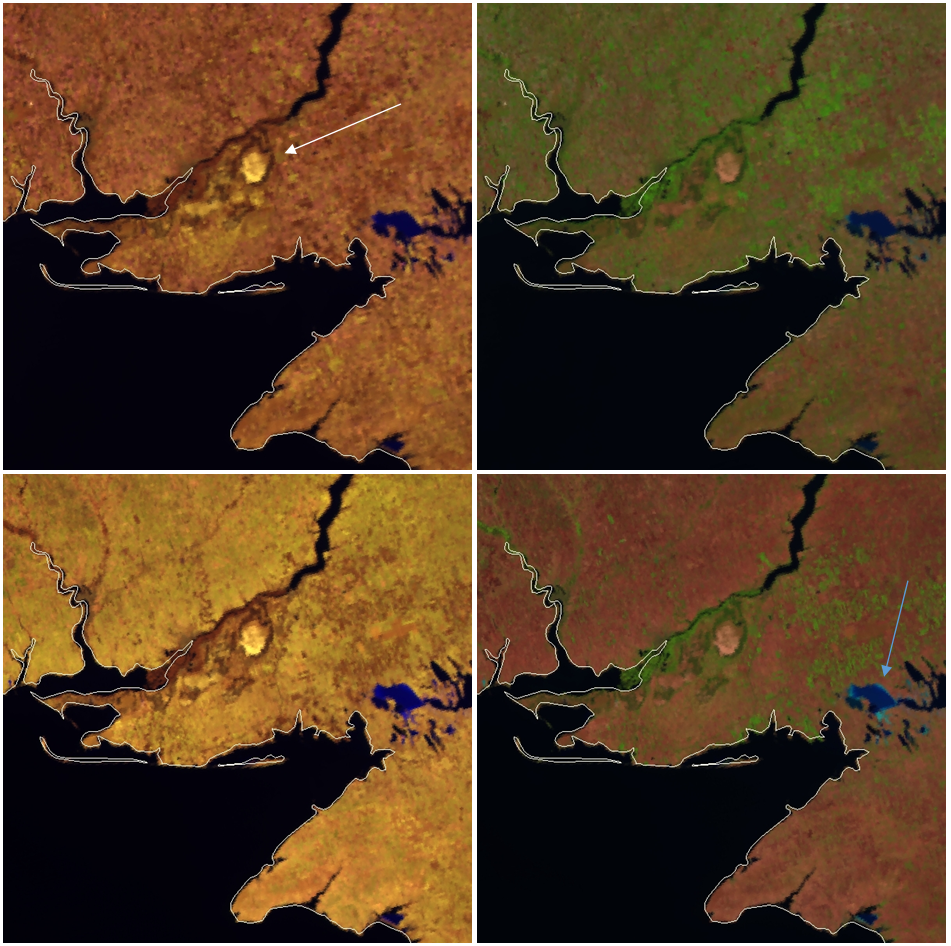
Fig 2: VIIRS Cloud Phase and Natural Colour RGB images for 27 June 2019, 11:40 UTC (upper left and right) and for 30 August 2020, 11:27 UTC (bottom left and right). The white arrow indicates the location of the national park, while the blue arrow indicate a salt lake.
The figure below shows Anatolia. The Anatolian highland is a large semi-dry area. It is covered mainly by steppe. Some parts are semi-desert. Dry grasslands cover the drier valleys and surround the saline lakes. In the Cloud Phase RGB the inner part of Anatolia appears mainly light brownish, close to yellow. The coast of the biggest saline lake (Lake Tuz) appears yellow. The saline lake appears dark blue/magenta in the Cloud Phase RGB, while cyan in the Natural Colour RGB.
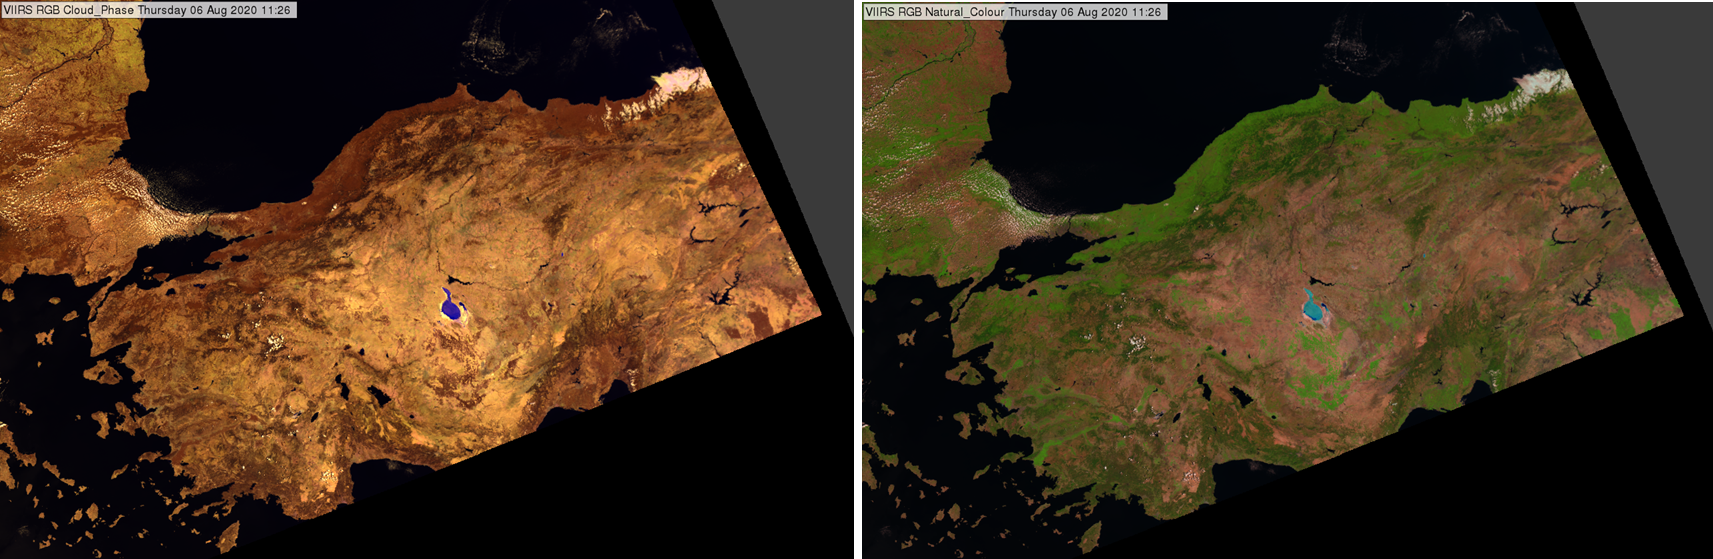
Fig 3: VIIRS Cloud Phase and Natural Colour RGB images for 6 August 2020, 11:26 UTC
Note:
• Land is seen only in cloud-free areas.
• The colour shades depend on the solar and satellite viewing angles as well.
• The colour shades of deserts or semi-deserts depend on their typical soil type (sand or rock, depending also on the material of the rock) and the type, fraction and greenness of the possible sparse vegetation.
• The Cloud Phase RGB is tuned for cloud top microphysical analyses. Land is just the background in these images. In case of land analyses other RGB types are recommended to use, e.g. Natural Colour or True Colour RGB.
o Different desert surface types might look similar in these images due to colour saturation, appearing homogeneously yellow.
o From the Cloud Phase RGB colour one cannot say unambiguously whether an area contains some green vegetation or just bare soil, rocks. They all may appear in lighter shades of brown.
Explanation of the colour of deserts and semi-deserts (see the recipe):
• The reflectivity values of sand is close to 50% both in NIR1.6 and NIR2.25 channels. So, in case of sandy deserts, the red and green signals are close to maximum. The blue signal is lower. As a consequence, the sandy desert appears yellow in the Cloud Phase RGB.
• The reflectivity values of rocks are usually lower than for sand. The actual reflectivity values, and the colours in the Cloud Phase RGB depend on the surface type.
• Sparse vegetation is depicted in brownish shades in the Cloud Phase RGB. The presence of green vegetation lowers the signals in all three colour beams and the red signal usually becomes strongest.
A sun glint appears yellow in the AVHRR Cloud RGB images, varying from dark blue with some yellowish tones (weak sun glint) to bright yellow (strong sun glint).
The open water surfaces are usually dark blue in AVHRR Cloud RGB images. An exception is the area of sun glint. A sun glint is the mirror-like reflection of the Sun from a water surface. Sun glints occur on cloud-free ocean, sea, river, lake surfaces at a given geometry of the sun and satellite viewing directions. In the sun glint area increased amount of solar energy is reflected from the water surface. Smooth ocean water becomes a "silvery mirror", while rougher surface waters (with big waves) appear less bright. As the ocean and sea is never perfectly smooth or calm, the Sun’s reflection gets blurred giving the water surface a washed out appearance.
On the right panel of the image below a sun glint can be seen both over the Black Sea and the Mediterranean Sea (north and south of Turkey) with variable strength. A very bright yellow patch south of the Turkish coast (north-east of Rhodes Island) shows very intense sun glint.
The left panel shows an image of the same area without sun glint, taken 50-minutes earlier. This image is presented to make it easier to distinguish sun glint from clouds on the right panel, which is not obvious, as the low- and medium-level clouds are also yellowish. The typical wash out appearance of sun glint helps to distinguish sun glint from clouds.
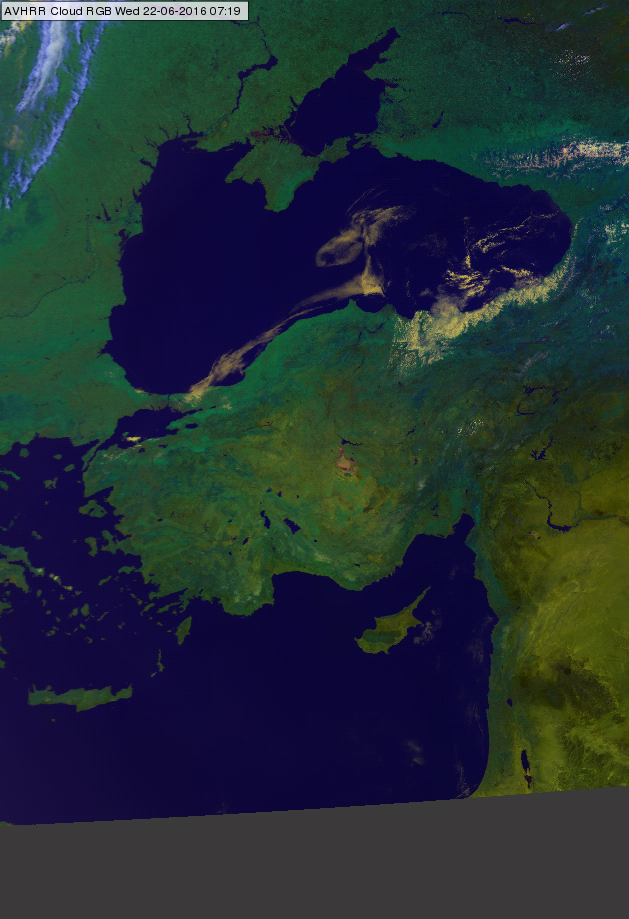
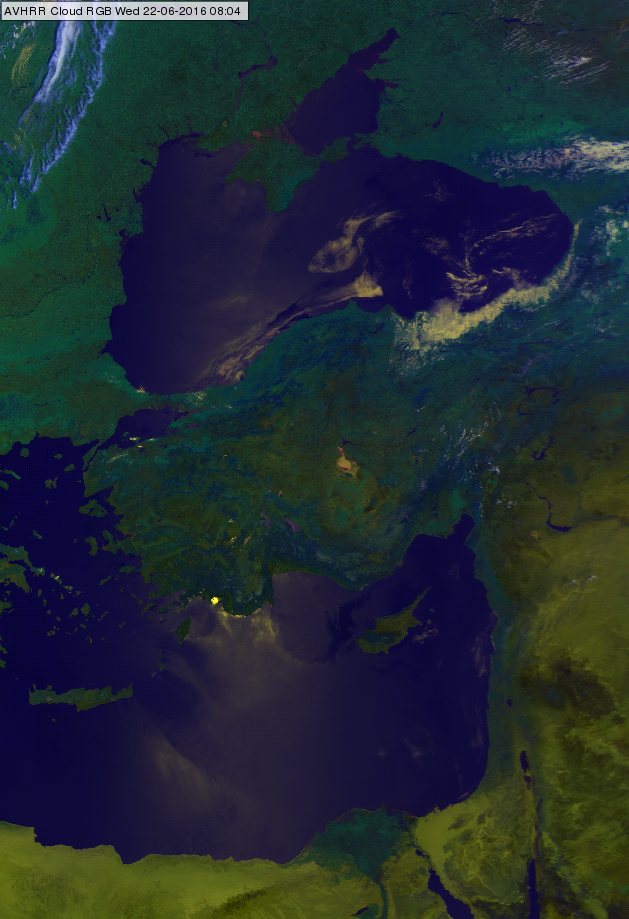
AVHRR Cloud RGB images of the Black Sea and eastern Mediterranean region for 22 June 2016 at 07:19 (left) and 08:04 (right) UTC
Some more examples are presented below.
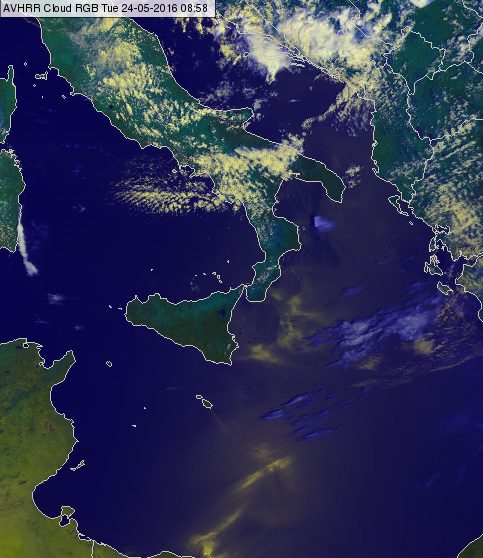

Sun glint over the Mediterranean Sea, AVHRR Cloud RGB images for 24 May 2016 at 08:58 UTC (left) and 08 May 2016 at 07:49 UTC (right)
Explanation of the colours of a sun glint (see the recipe):
• The open water surface without sun glint is dark blue: the red and green components are almost zero, while the blue component is somewhat stronger but still low.
• In case of sun glint the red and blue signals increase, while the blue component does not change. As the reflection is similarly intensive in the VIS0.63 and NIR0.87 channels, the sun glint appears yellowish in the AVHRR Cloud RGB images.
Cold sandy deserts depict in a yellow colour in the Dust RGB images.
Only the red and the green colour contribute when radiantion stems from a cold sandy desert surface (red + green = yellow).
The red colour beam consists of the brightness temperature difference (BTD) IR12.0 - IR10.8. This difference is around zero over land. Given a temperature range from -4°C to +2°C, the red colour contribution is medium to high.
Sandy deserts have a much lower emissivity at 8.7 than at 10.8 micrometer. Therefore the BTD (IR10.8 - IR8.7) is largely positive and results in a high green contribution.
The blue colour contribution is minor as the surface temperature of a sandy desert during the night is very low.
The Dust RGB image below shows the sandy desert in Saudi Arabia during the night. The regions with sand (yellow) are clearly delimitted from regions with other land types like rocks, vegetation, etc (red).
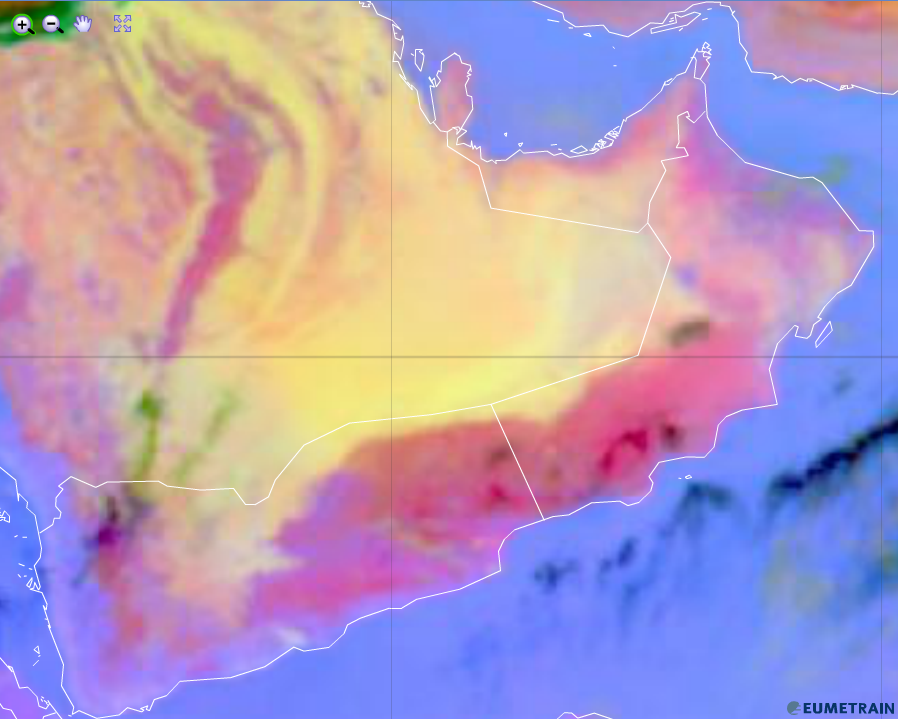
Dust RGB from 14 February 2016, 00:00 UTC
Explanation of the yellow colour of a cold sandy desert in the Dust RGB (see the recipe):
In case of a cold sandy desert (e.g. night-time), only the red and the green colour beams contribute.
Mixed volcanic ash and sulphur dioxide gas plumes appear yellow in the Ash RGB images.
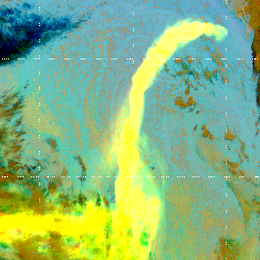
The images below show ash cloud (red) and mixed ash and SO2 plumes (yellow) meandering over the Southern Atlantic. These clouds were ejected by the Puyehuè-Cordón Caulle Volcanic Complex in Chile.
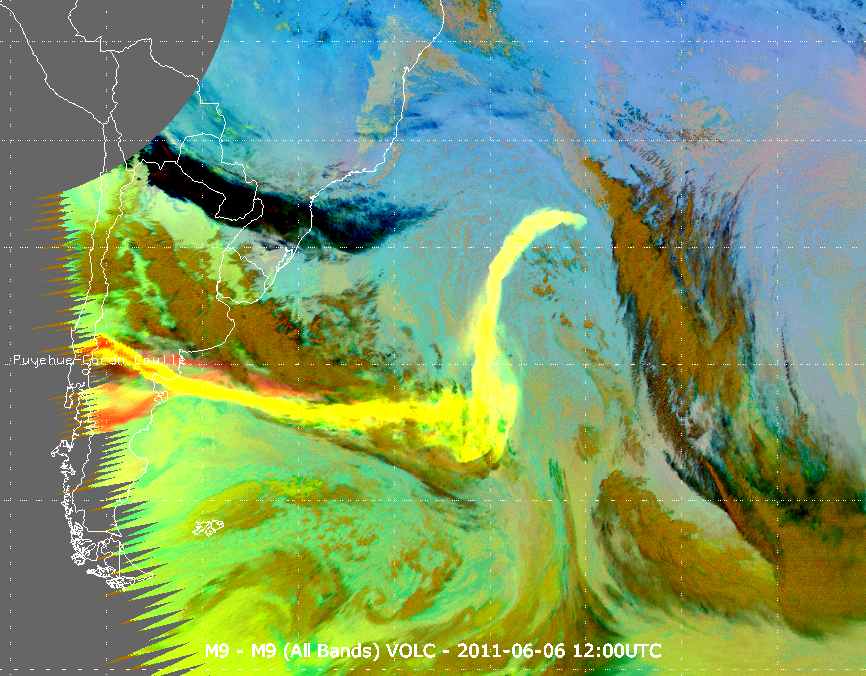
Meteosat, SEVIRI Ash RGB for 06 June 2011, 12:00 UTC (Source: EUMETSAT, Image Library)
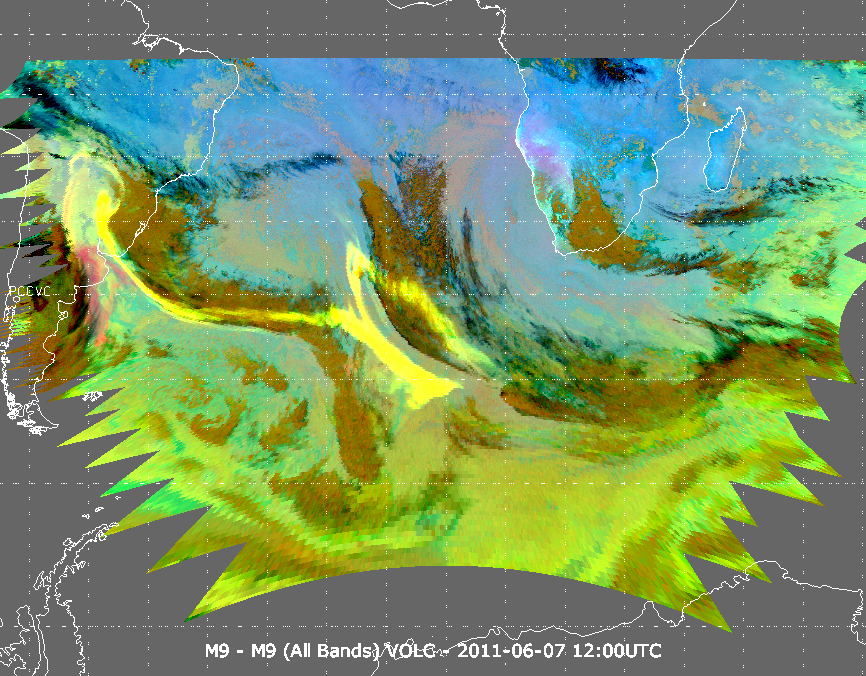
Meteosat, SEVIRI Ash RGB for 07 June 2011, 12:00 UTC (Source: EUMETSAT, Image Library)
Explanation of the colours of mixed volcanic sulphur dioxide gas and ash plumes (see the recipe):
• For ash clouds the red component is high, (because a thin ash cloud is more transparent in the 12.0 micrometer channel than in the 10.8 micrometer channel.)
• For SO2 gas plume the green component is high, (because SO2 gas has absorption band around 8.7 micrometer, while does not absorb the radiation at 10.8 micrometer channel).
Ash contributes with reddish and SO2 with greenish hues to the RGB, resulting in the yellow colouring.
Semitransparent ice clouds can be shown in several colours in the Snow RGB images: from orange, yellowish to pale blue colours.
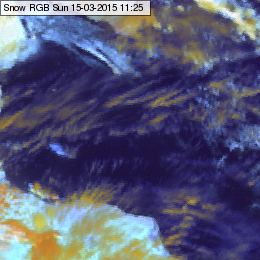
The colour of the thin cirrus is in between the colour of the thick ice cloud (orange) and that of the underlying cloud or surface. Thicker cirrus clouds are orange, thin cirrus clouds can also appear orange (over thick ice clouds or snowy land), light blue (over desert), pale blue (over sea), light yellowish (over water clouds) etc. The image below shows cirrus clouds over sea and desert.
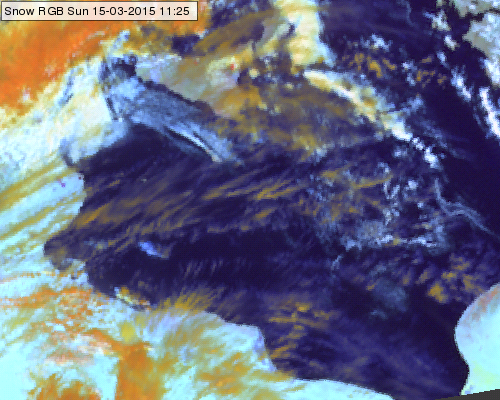
Meteosat, SEVIRI Snow RGB image for 15 March 2015 11:25 UTC
Thin cirrus looks like a yellowish, bluish veil, see the images below. The images below show thin cirrus clouds over snow, water clouds, land and sea.
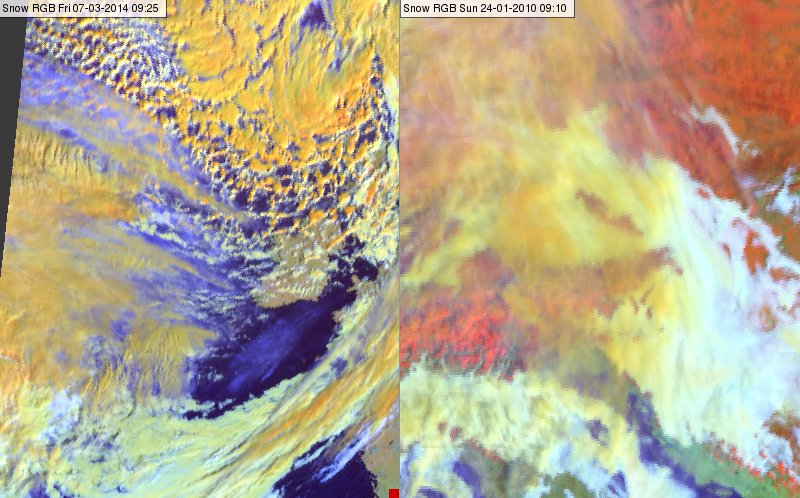
Meteosat, SEVIRI Snow RGB images for 07 March 2014 09:25 UTC (left) and 24 January 2010 09:10 UTC
Explanation of the colours of the semitransparent clouds (see the recipe):
In case of semitransparent clouds the satellite measures mixed radiation consisting of the radiation emitted or reflected by the semitransparent cloud itself and the radiation originated from below and transmitted through it. That is why the colour of a semitransparent cloud depends not only on the characteristics of the cloud itself, but also on the transparency and the colour of the underlying surface.
• The colour of the almost thick semitransparent cloud approximates the colour of the thick ice clouds (orange).
• The colour of the very thin cirrus clouds approximates the colour of the underlying clouds or surface (orange, white, dark blue, red, green, light blue).
• The colour of the thin cirrus is between the colour of the thick ice cloud and that of the underlying cloud or surface.
Thick ice clouds are depicted in red or yellow colours in the Severe Storms RGB images. In the areas where the particle size is small and/or the cloud top is very cold it will appear yellow. When ice particles become large the cloud colour will turn into red. Transitional colours (e.g. orange) may also appear.
Dust polluted ice clouds usually depict yellow in the Severe Storms RGB, because their tops consist of small ice crystals due to the high number of the condensation nuclei. As a consequence clouds which are usually red (like a front) on Severe Storms RGB may become yellow in case they are highly polluted.
Below two different RGB images are seen. In the Dust RGB (left) the pink colour shows a fully developed, spectacular dust spiral in conjunction with a low-level depression. Generally, the entrainment of desert dust into Cb or Ns clouds leads to the formation of small ice particles, and indeed the yellow colour of the high-level ice clouds in the Severe Storms RGB image (right) indicates the presence of small ice crystals.
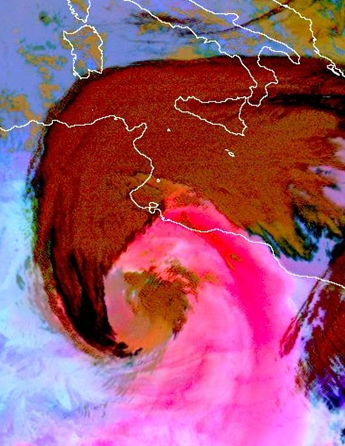
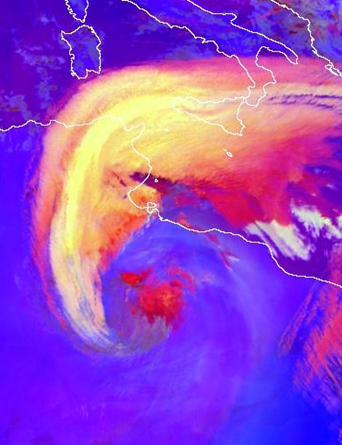
Meteosat-8, Dust RGB image (left) and Severe Storms RGB image (right) for 22 February 2007, 12:00 UTC
Small ice particles can stay up in the air without evaporating or falling out, such clouds typically preserve their characteristics over a longer period of time, see below the images of three successive days. The colour is still yellowish even 48 hours later.
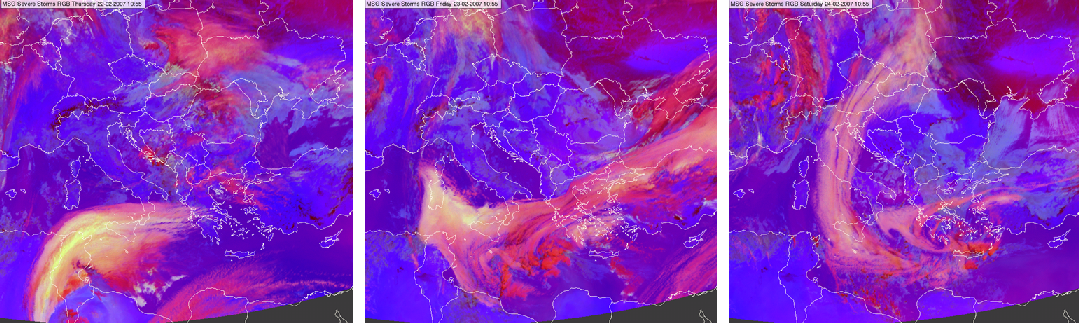
Meteosat SEVIRI Severe Storms RGB images for 22 (left), 23 (middle) and 24 (right) February 2007, 10:55 UTC
Note that small ice crystals may appear on the cloud top not only due to pollution. Small ice crystals can be as well observed: on the top of deep convective clouds with strong updraft, on the tops of storms with cold (high) cloud base and in high level lee clouds.
Explanation of the colours of highly polluted thick ice clouds (see the recipe):
• The difference (WV6.2 – WV7.3) is almost zero yielding a relative high input because the temperature range between -35 K and +5 K is considered.
• The difference (IR3.9 – IR10.8) is high in case the cloud top consists of small particles,
• The difference (NIR1.6 – VIS0.6) is low because the ice cloud reflectivity values are much lower around 1.6 micrometer than around 0.6 micrometer.
As a consequence the signal will be intense in red and green and low in blue colour beams for highly polluted thick ice clouds.
Thick ice clouds are depicted in red or yellow colours in the Severe Storms RGB images. In the areas where the particle size is small and/or the cloud top is very cold it appears yellow.
The high level lee clouds are very cold and consist of very small particles. (Homogeneous freezing processes at very low temperatures typically lead to the formation of very small ice particles. Furthermore at the height they form the available humidity is rather low.) As a consequence the thick part of the high level lee cloudiness usually shows up in bright yellow colour tones. The thin parts are pinkish.
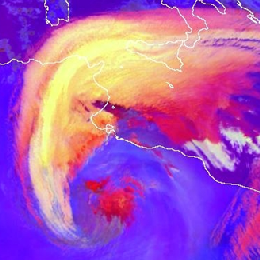
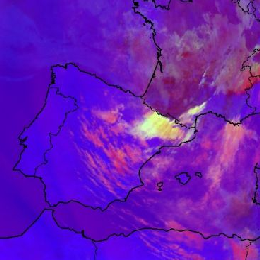
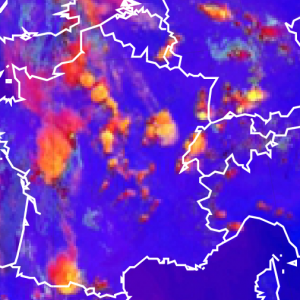
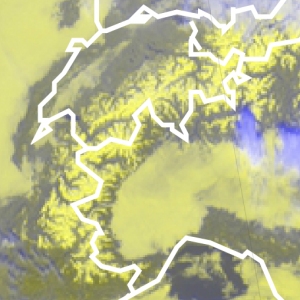
The image below shows a Severe Storms RGB image. High level Lee clouds are seen south of the Pyrenees and Cevennes. The bright yellow colour indicates the presence of very small ice particles.

Meteosat, SEVIRI, Severe Storms RGB image for 17 May 2007, 10:10 UTC
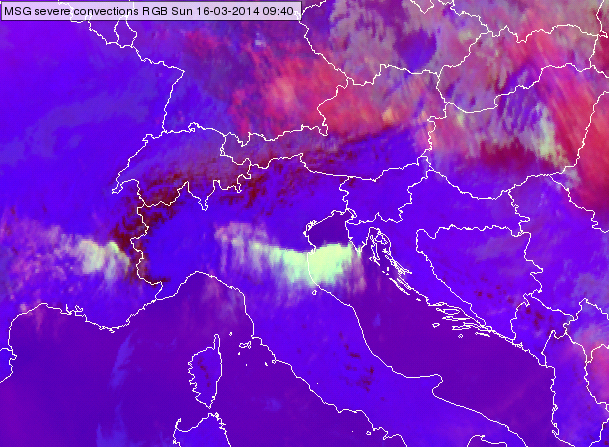
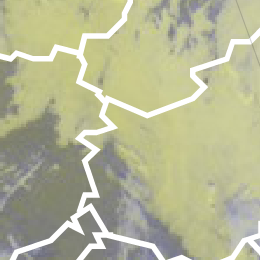
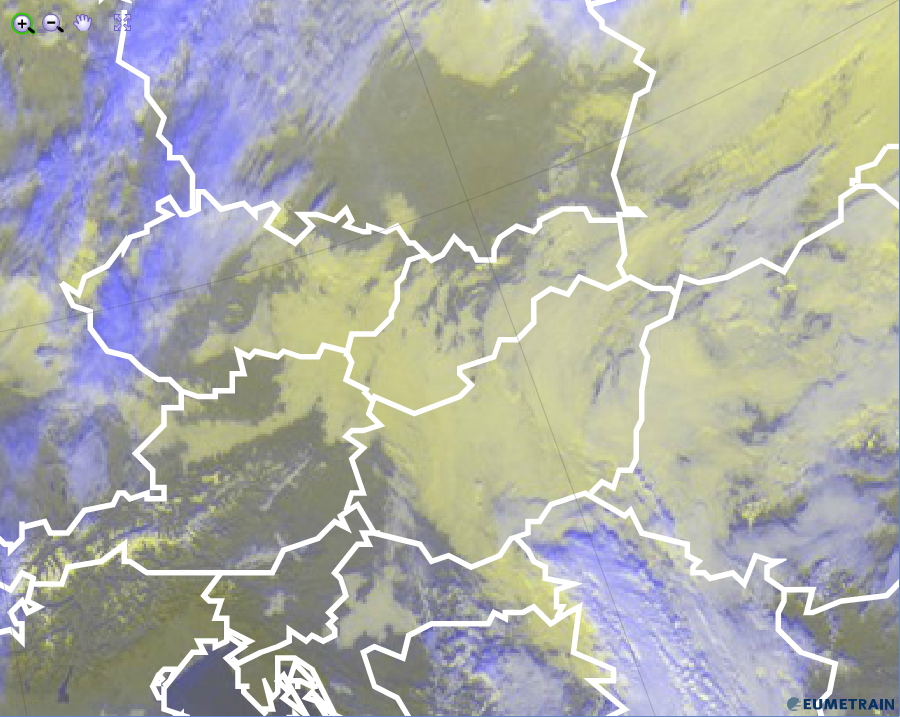
The next image shows high level lee clouds formed over several mountains: the mountains of Corsica, the Apennines, the Dinaric Alps and the Carpathian Mountains.
Meteosat-8, SEVIRI Severe Storms RGB image from 19 March 2007, 08:00 UTC
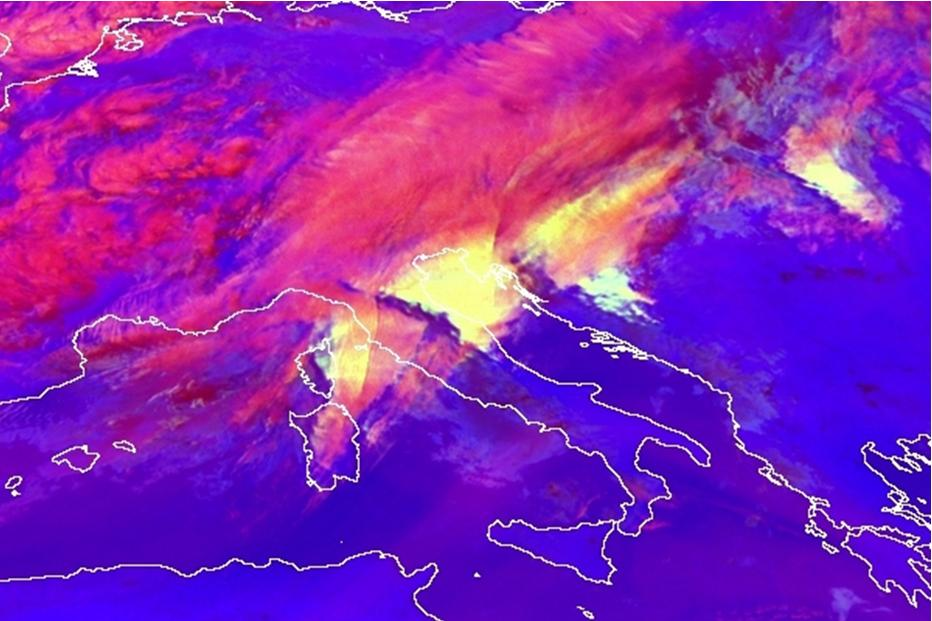
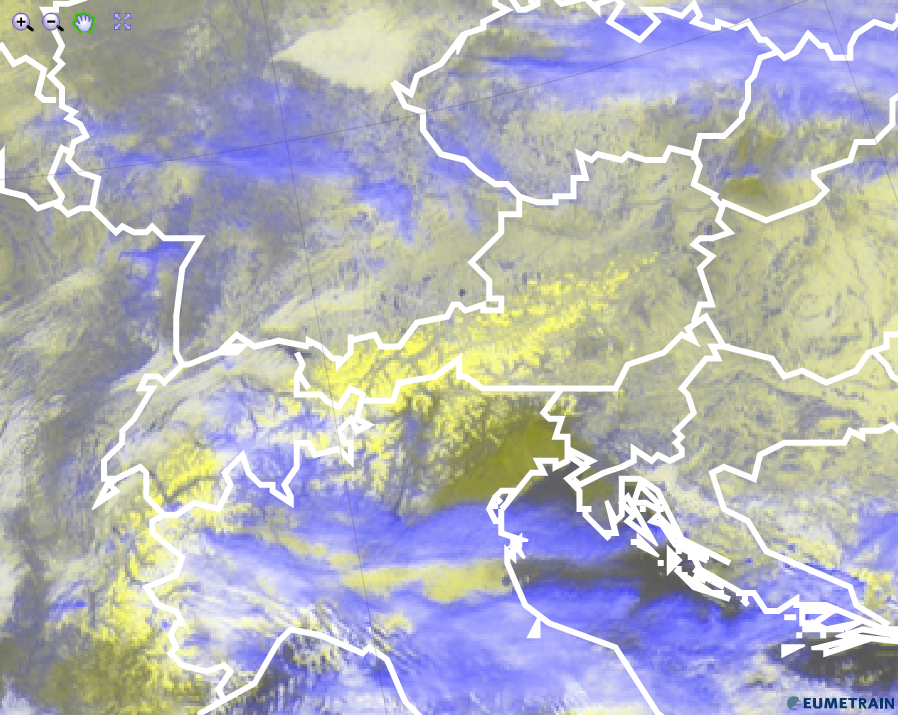
The image below shows high level clouds south of the Alps over Italy and Adriatic Sea. East of the Alps over France we see also high level lee clouds. Note that in this case the lee cloud is rather whitish than yellow.
Meteosat SEVIRI, Severe Storms RGB image from 16 March 2014 09:40 UTC
Explanation of the colours of thick high level lee cloud (see the recipe):
• The difference (WV6.2 – WV7.3) is usually negative, but for thick high ice clouds it is around zero resulting in intense signals for the red colour beam.
• The difference (IR3.9 – IR10.8) is large because the cloud top is very cold and it consists of small particles resulting in intense signals for green colour beam.
• The difference (NIR1.6 – VIS0.6) is usually negative for ice clouds (much lower reflectivity around 1.6 than around 0.6 micrometer). However, if the particles are small the NIR1.6 reflectivity increases resulting ‘considerable’ signal in blue colour beam. If the ice crystals are extreme small the signal may become high.
As a consequence the signal will be intense in the red and green colour beam and also ‘considerable’ in blue colour beam. It is the difference of the (NIR1.6-VIS0.6) channels which determines whether the resulting colour will be bright yellow or in extreme cases whitish.
Note that small ice crystals may form not only in high level lee clouds. Small ice crystals can as well be observed: on top of storms with intense updraft, on the tops of storms with cold (high) cloud base and on the tops of polluted thick ice clouds.

Fog over the North Sea and in the eastern valleys of Scotland and England are yellowish/ochre in the Cloud RGB images, because their reflectivity values are high and close to each other in both visible channels, the 0.63 and 0.87 micron channels, while their cloud top temperature is relatively high (close to the temperature of the surface). As the 10.8 micron channel is inverted in this RGB, warm temperature means dark shades in the blue colour beam. Nevertheless the blue colour beam is weaker than the red and green beam. This leads to a yellowish/ochre colour of low clouds. See the recipe.
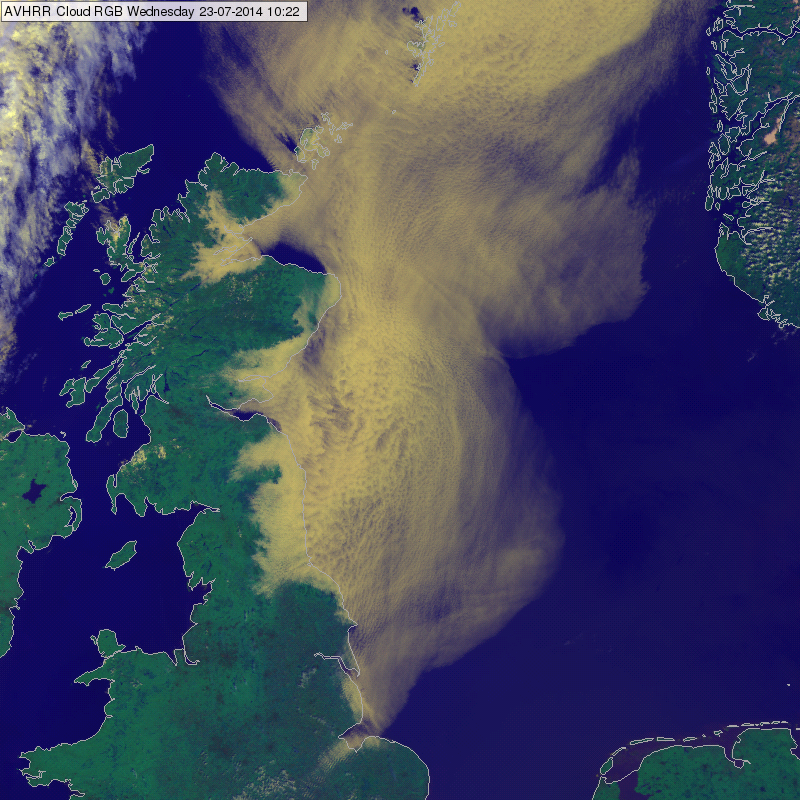
MetOp AVHRR Cloud RGB image, 23 July 2014 10:22 UTC
Thick ice clouds in convective cells are depicted in red or yellow colours in the Severe Storms RGB images. The areas where the particle size is small and/or the cloud top is very cold will appear in yellow colours. When ice particles become large and/or the cloud top warmer the cloud colour will turn into red. Transitional colours (e.g. orange) will also appear.
Developing, active thunderstorms with strong updraft usually have bright yellow colours (beside red and orange) on its top, mainly at the location of the updraft region. This RGB can be used to locate the active parts of extended convective cells.
The yellow colour can be caused by:
• Very cold cloud top temperature, e.g. very cold overshooting tops caused by strong updraft.
• Small ice crystals on (or above) the cloud top. Strong updrafts bring small ice particles up to the cloud top. Due to the strong updraft the water particles formed at the cloud base have not much time to become larger by coagulation before freezing. (Note that the small ice crystals may belong to an above anvil cirrus cloud, as well.)
• The combined effect of very cold cloud top temperature and small ice crystals.
If the yellow colour is caused by the presence of small ice crystals resulting from strong updrafts and spreading along the anvil, then first the updraft area, i.e. the overshooting top, turns into yellow. When the updrafts persist, the yellow area enlarges gradually.
The images below show severe convective systems over Central Europe.
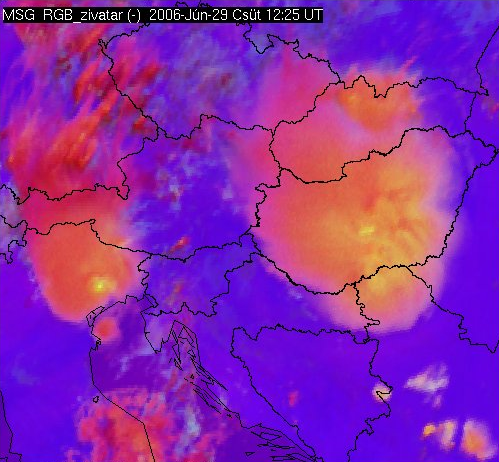
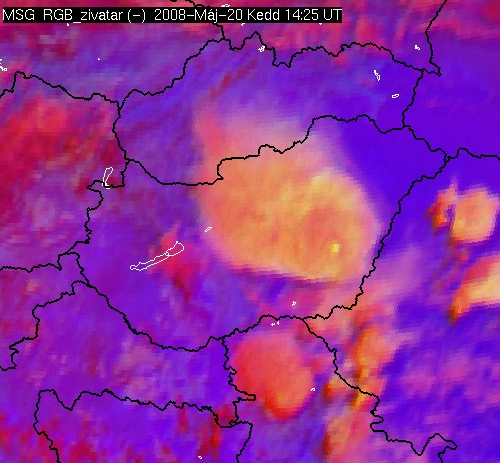
Meteosat, SEVIRI Severe Storms RGB images for 29 June 2006 12:25 UTC (left) and 20 May 2008 14:25 UTC (right)
The image below shows convection above Africa.
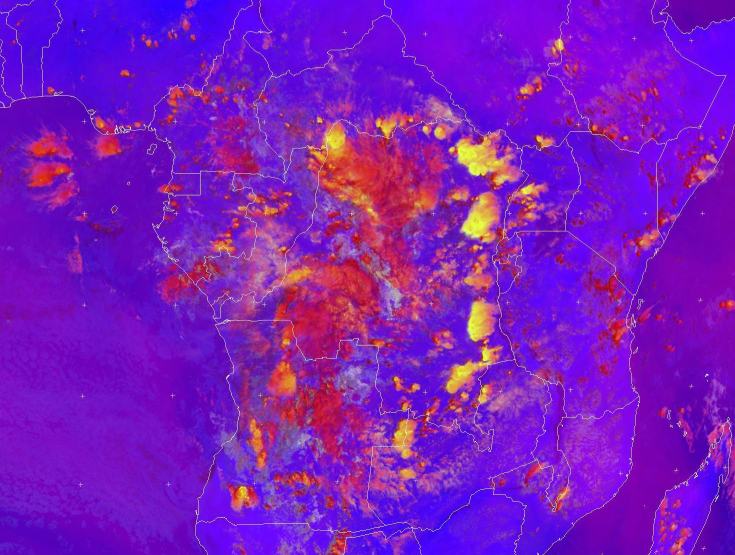
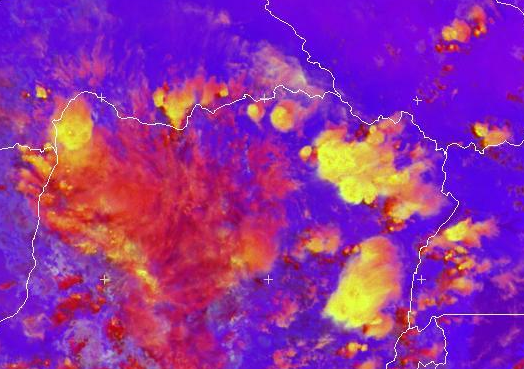
Note that small ice crystals may form not only due to intense updraft. Small ice crystals can be as well observed: on the tops of storms with cold (high) cloud base, in high level lee clouds and on the tops of polluted thick ice clouds.
Explanation of the colours of thick ice clouds (see the recipe):
• The difference (WV6.2 – WV7.3) is usually negative, but for high ice clouds it is around zero resulting intense signals in the red colour beam.
• The difference (IR3.9 – IR10.8) is high in case the cloud top is very cold and/or it consists of small particles, otherwise it is lower. (This difference serves as an approximation of the 3.9 micrometer reflectivity value - small ice crystals reflect more solar radiation than large ones. However, it depends on the cloud temperature as well.)
• The difference (NIR1.6 – VIS0.6) is large negative because the reflectivity values of ice clouds are much lower around 1.6 micrometer than around 0.6 micrometer. This gives low signal in the blue colour beam.
As a consequence the signal will be intense in red and low in blue colour beams for thick ice clouds. The difference of the (IR3.9 – IR10.8) determines whether the resulting colour will be red or yellow or some colour in between.
Snow and ice on the ground appear yellow in the HRV Cloud RGB images.
Snow and ice on the ground strongly reflect short wave solar radiation, hence the strong intensity of the red and green colour beam (red + green = yellow). The albedo of snow on plane ground differs from the albedo of snow and ice in the mountains as can be seen on the image below. This difference arrises from the vegetation cover disrupting the uniform snow cover (e.g. trees) compared to the vegetationless mountains.
The blue colour contribution from the window channel IR10.8 has an average value over snow caused by its relatively warm temperature compared to clouds. In case of temperature inversions with very cold temperatures on the ground, the blue contribution is smaller in mountain regions than in the surrounding land. This also enhances the yellow hue of the snow on mountains.
HRV Cloud RGB from 8 February 2012, 12:00 UTC
Explanation of the yellow colour of snow and ice on the ground in the HRV Cloud RGB (see the recipe):
• Only the HRV channel contributes notably to the HRV Cloud RGB for snow and ice on the ground. The addition of red and green results in a yellow hue.
Low level water clouds appear yellow in the HRV Cloud RGB images.
Water droplets strongly reflect short wave solar radiation, hence the strong intensity of the red and green colour beam (red + green = yellow) .
The blue colour contribution from the window channel IR10.8 has an average value caused by the relatively warm cloud tops. It contributes more when the cloud tops are colder. Especially in the winter season, when low stratus and fog are most frequent (see image below), they depict in yellow tones. The colder the cloud tops are, the more the yellow will turn into grey (and white for very high opaque clouds). Notice that the intensity of the blue colour beam intensifies with decreasing cloud top temperatures.
On the image below, the HRV Cloud RGB shows low stratus and/or fog in central Europe.
HRV Cloud RGB from 19 December 2015, 12:00 UTC
The image below shows ship trails over the Atlantic. Water in the exhaust from cargo vessels condensates and forms long trails. These low level water clouds can be seen in the HRV Cloud RGB.
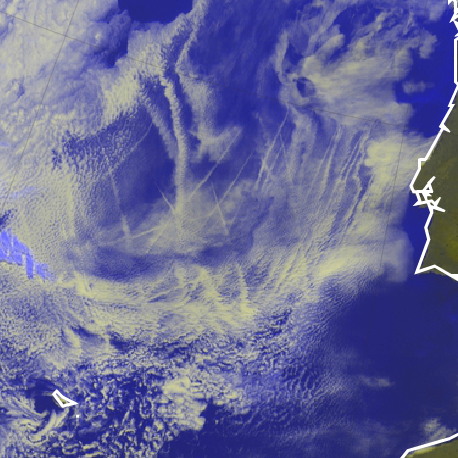
Ship trails over the Atlantic ocean.
Explanation of the yellow colour of low-level clouds in the HRV Cloud RGB (see the recipe):
Only the HRV channel contributes notably to the HRV Cloud RGB for low level clouds. The addition of red and green results in a yellow tone.