
Identify surface features
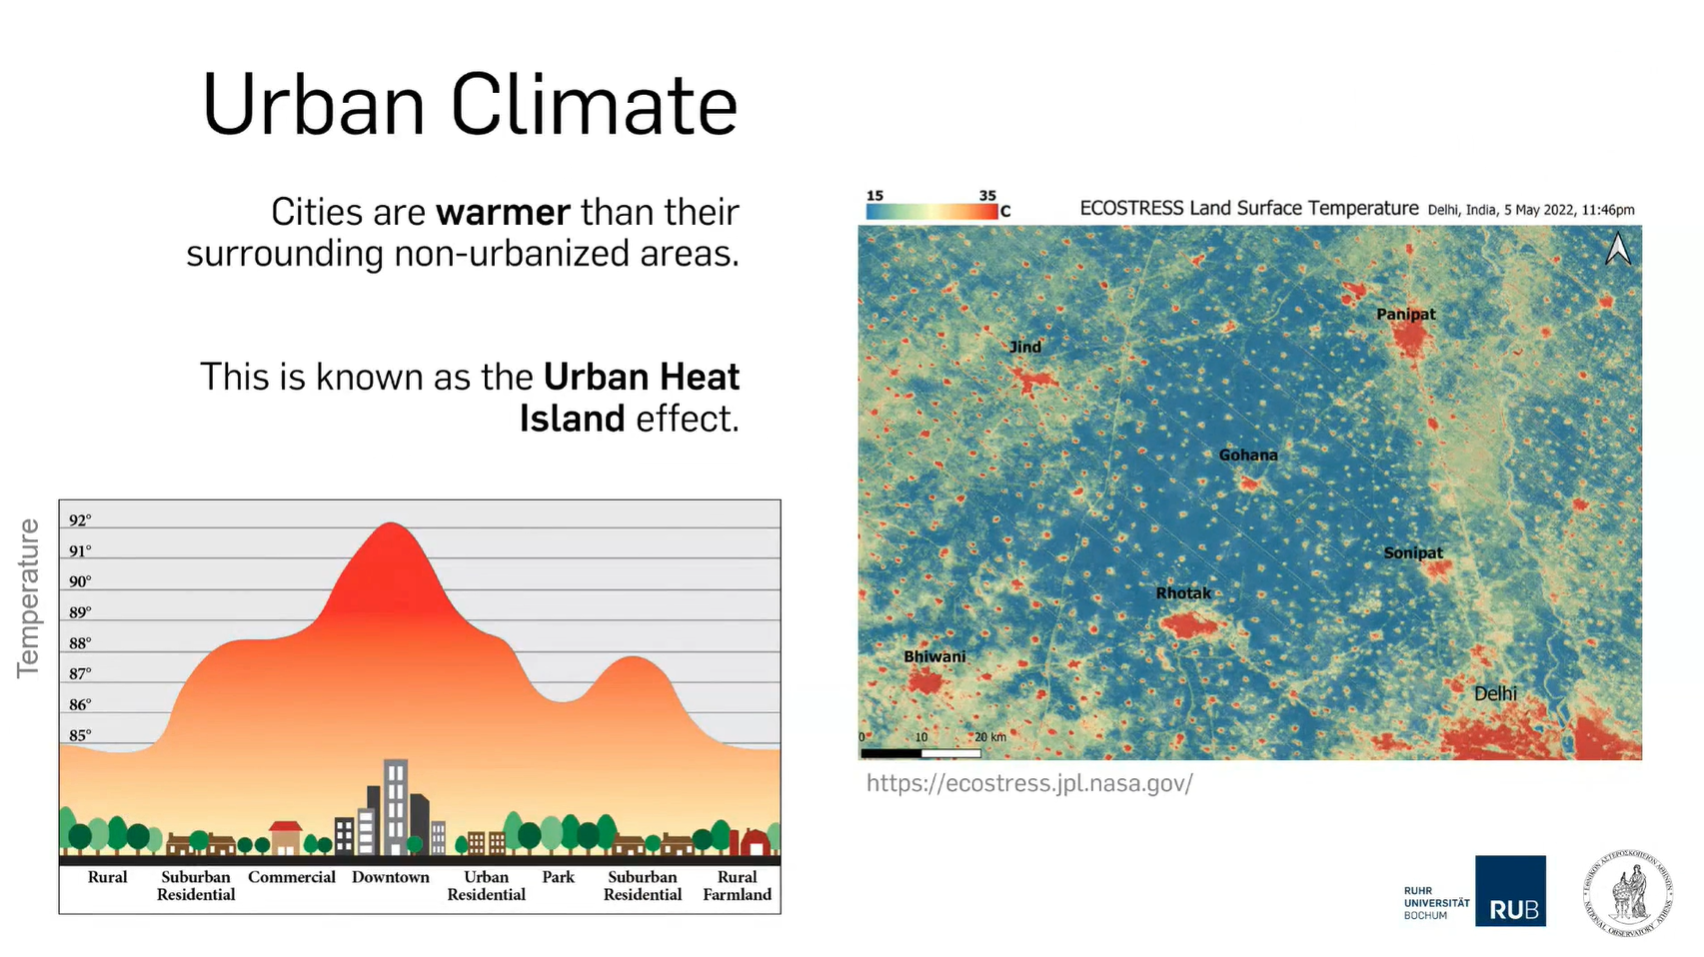
Panagiotis Sismanidis provides insight into urban heat islands including its drivers and impacts.
Cities are generally warmer than their surroundings. This phenomenon is known as the Urban Heat Island (UHI) and is one of the clearest examples of human-induced climate modification. UHIs increase the cooling energy demand, aggravate the feeling of thermal discomfort, and influence air quality. In this talk we will discuss the drivers and impacts of UHIs and showcase how to characterize the urban landscape in Local Climate Zones. We will also discuss the discrepancies between remotely-sensed land surface temperatures (LST) and near-surface air temperatures when studying the urban climate.
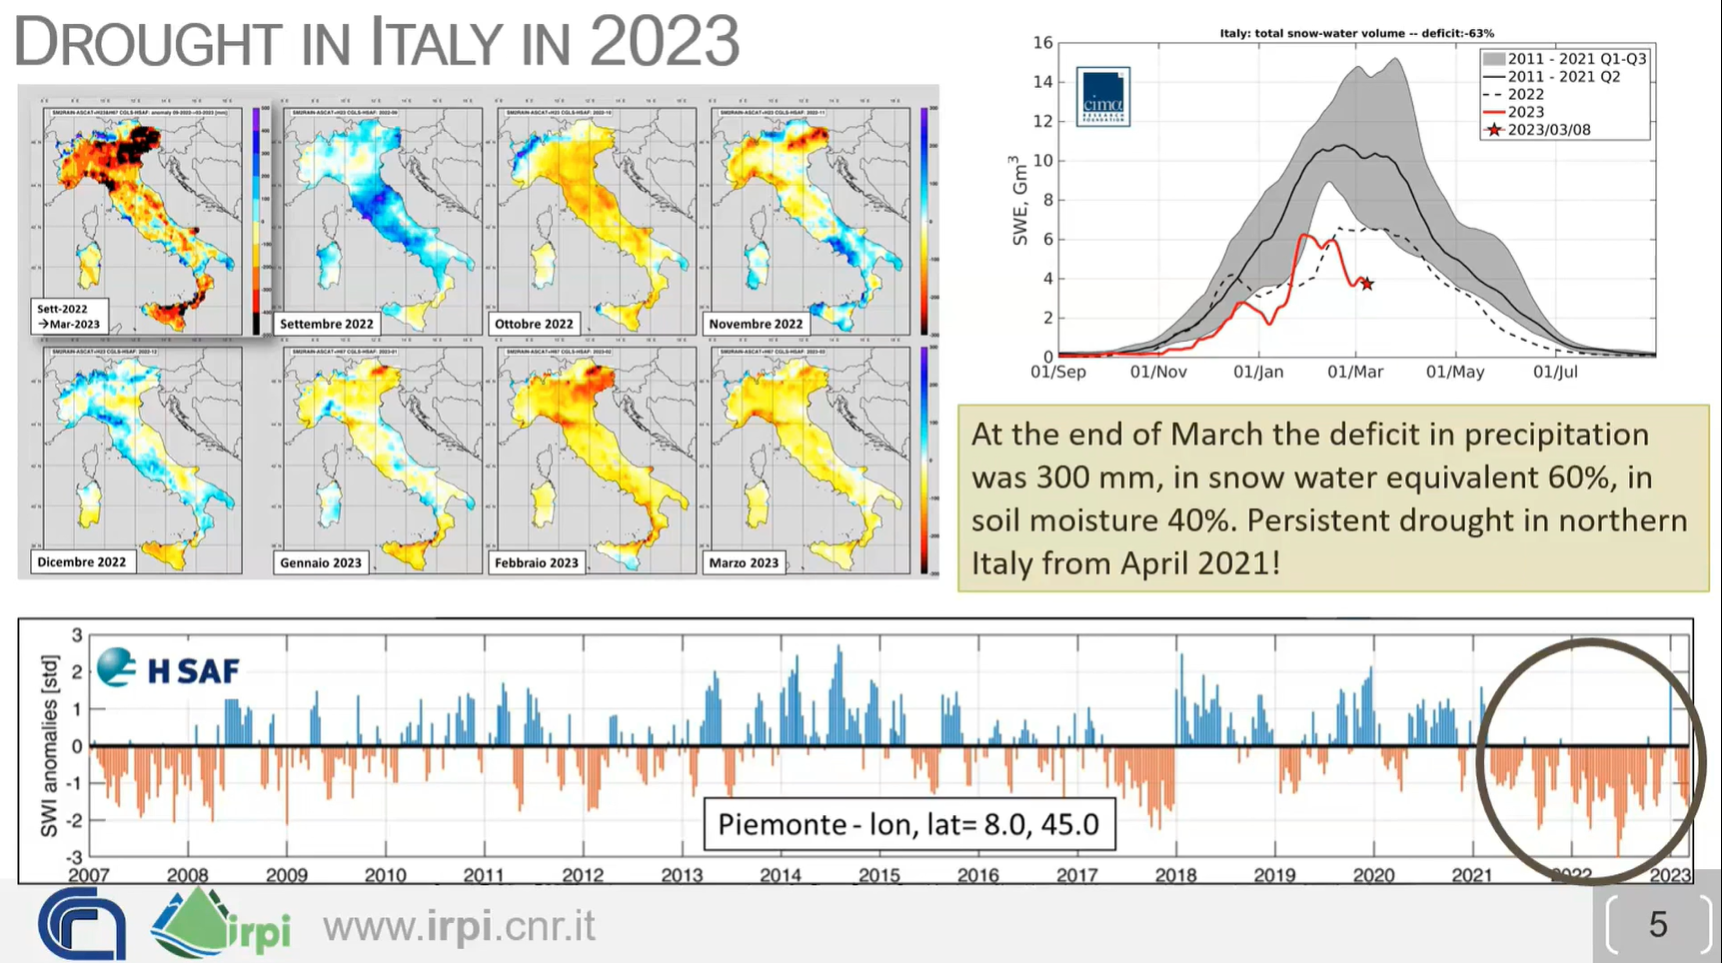
Luca Brocca shows how to combine multiple satellite derived variables to monitor drought.
How do we monitor drought? Is it enough to use only precipitation data and calculate the SPI (Standardized Precipitation Index)? New satellite-derived products (precipitation, evaporation, soil moisture and snow) offer additional ways to monitor drought in space and time, to assess WHERE the water is (surface soil, root zone soil, snowpack), and thus to know WHEN the water will be available. Real-world case studies will be analyzed together with the participants, also using an interactive platform (https://explorer.dte-hydro.adamplatform.eu/). The objectives of the lecture are: (1) to assess drought risk based on (new) satellite observations, and (2) to translate drought risk information into real-world decisions for water resources management (e.g., reservoir management, irrigation, hydropower generation).
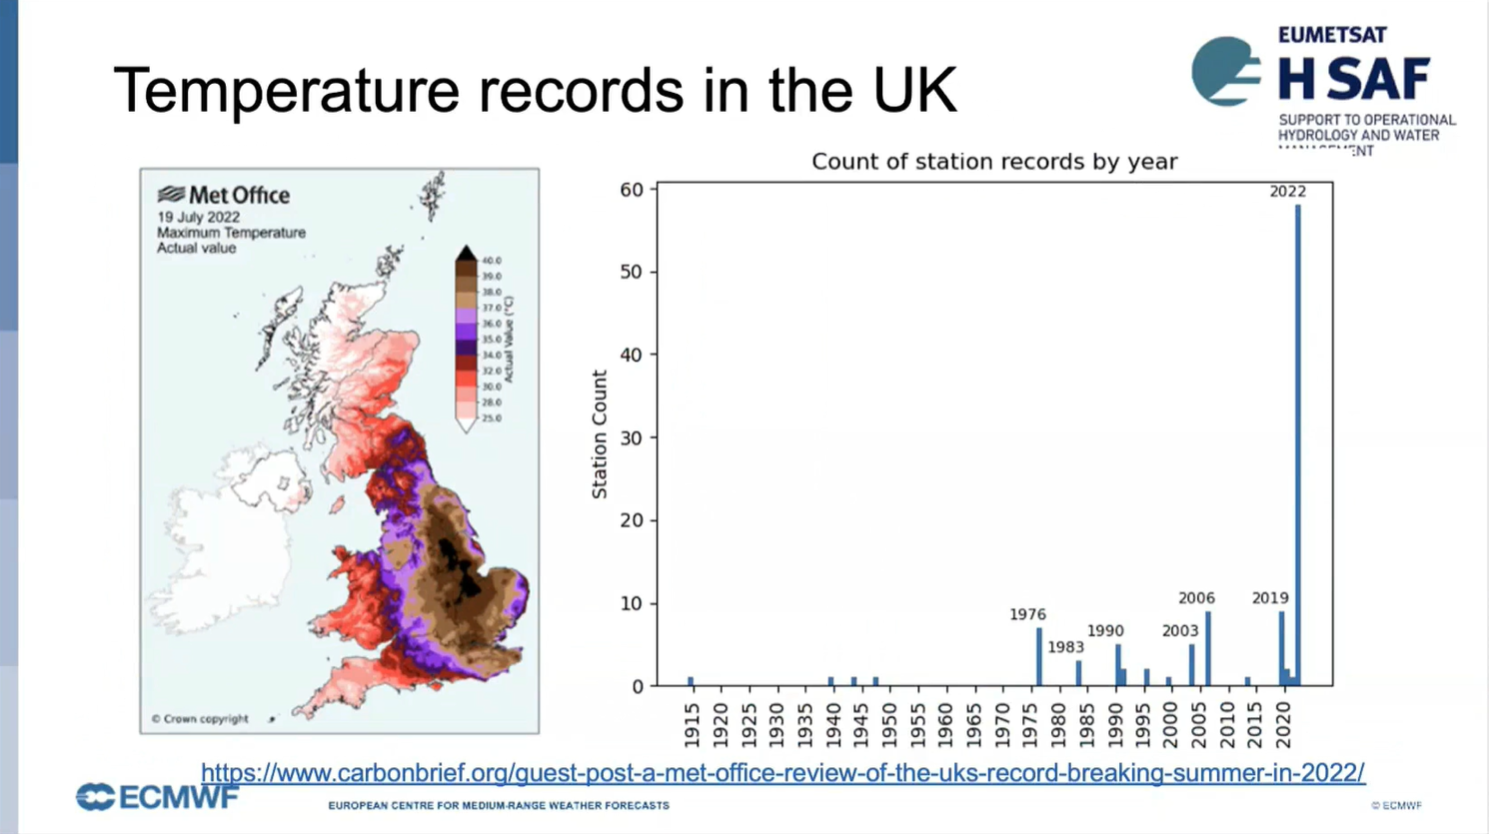
David Fairbairn talks about soil moisture and drought monitoring and using H SAF datasets.
H SAF soil moisture (SM) products are derived from ASCAT C-band backscatter measurements. In this presentation we compare the near-real-time products with long-term data records in order to demonstrate the exceptional severity and extent of recent droughts, including the 2022 summer drought over Europe.
João Martins talks about using Land Surface Temperature (LST) in heatwave monitoring using LSA SAF datasets.
Heat and water stress leave clear signatures on land surface variables that can be monitored from space. The LSA SAF has been providing satellite datasets and products that allow the characterization of the surface energy budget and the monitoring of vegetation growth and stress. We will show that combining information on the surface temperature diurnal cycle and on vegetation state provides a different perspective on the spatial extent and time evolution of droughts and heatwaves, and reveals underlying soil vegetation-atmosphere feedbacks.
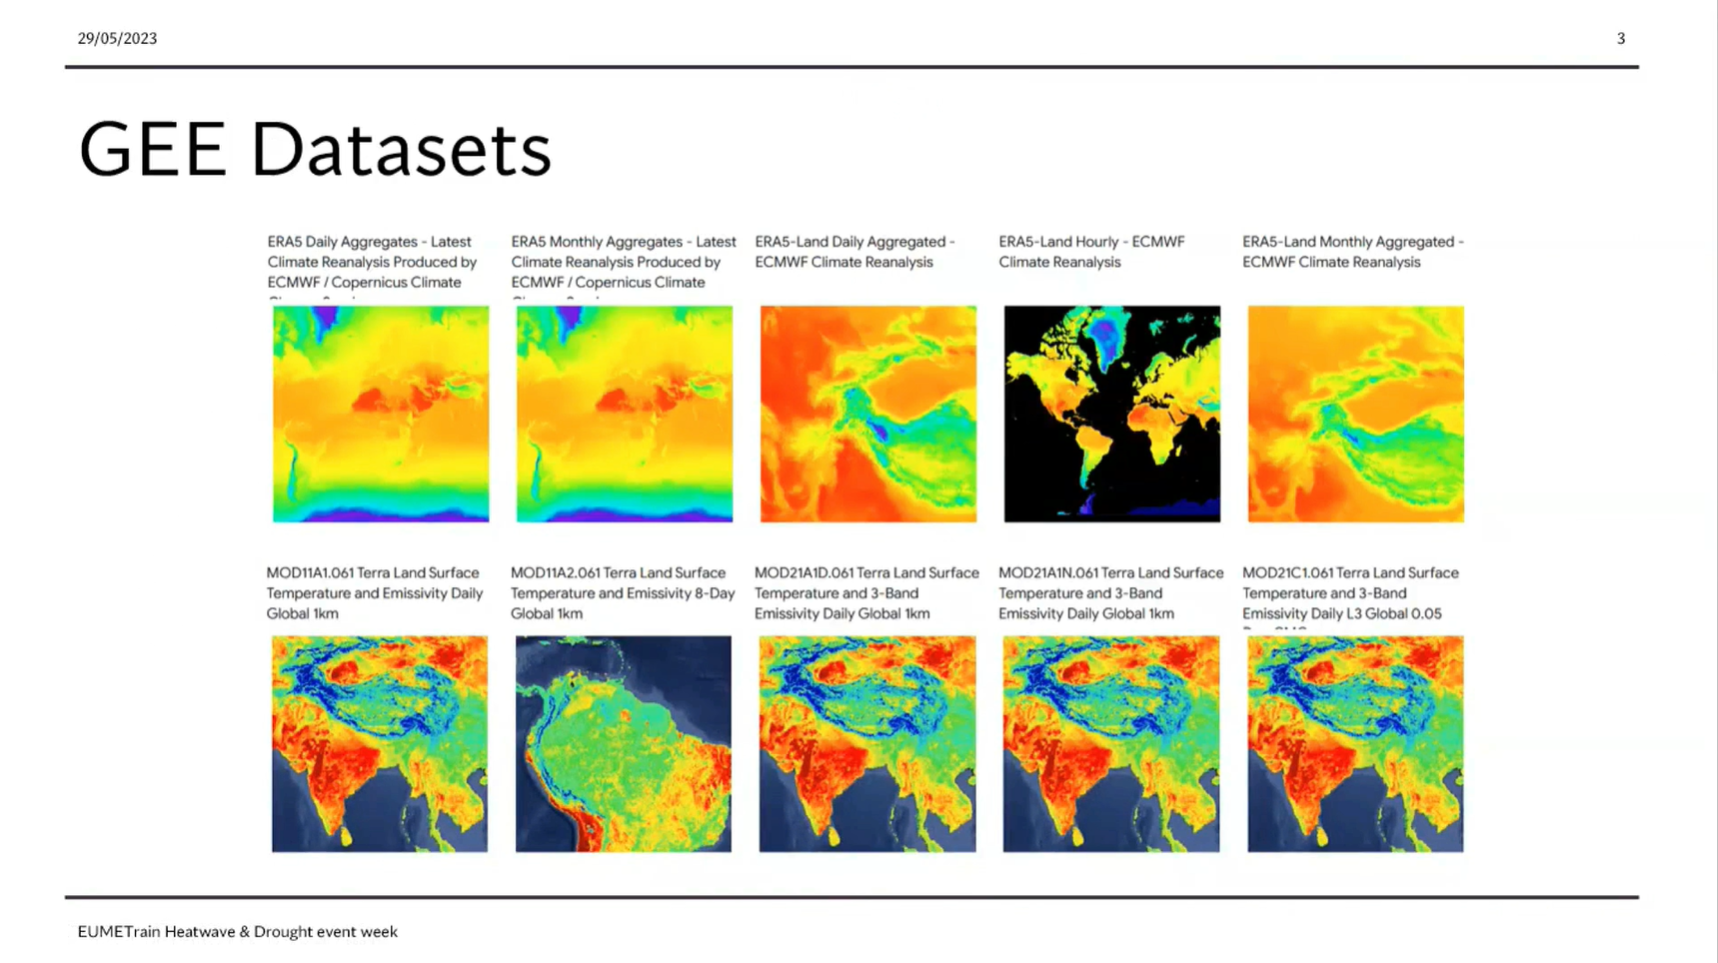
Sofia Ermida showcases the use of Google Earth Engine in Heatwaves and Drought monitoring
The Google Earth Engine (GEE) is a powerful tool for researchers providing easy access to a large array of environmental datasets, particularly from remote sensing, and the computational resources to analyzed them. Here we present an overview of the capabilities and datasets of the GEE useful for the study of heatwaves and droughts and provide some examples of applications.
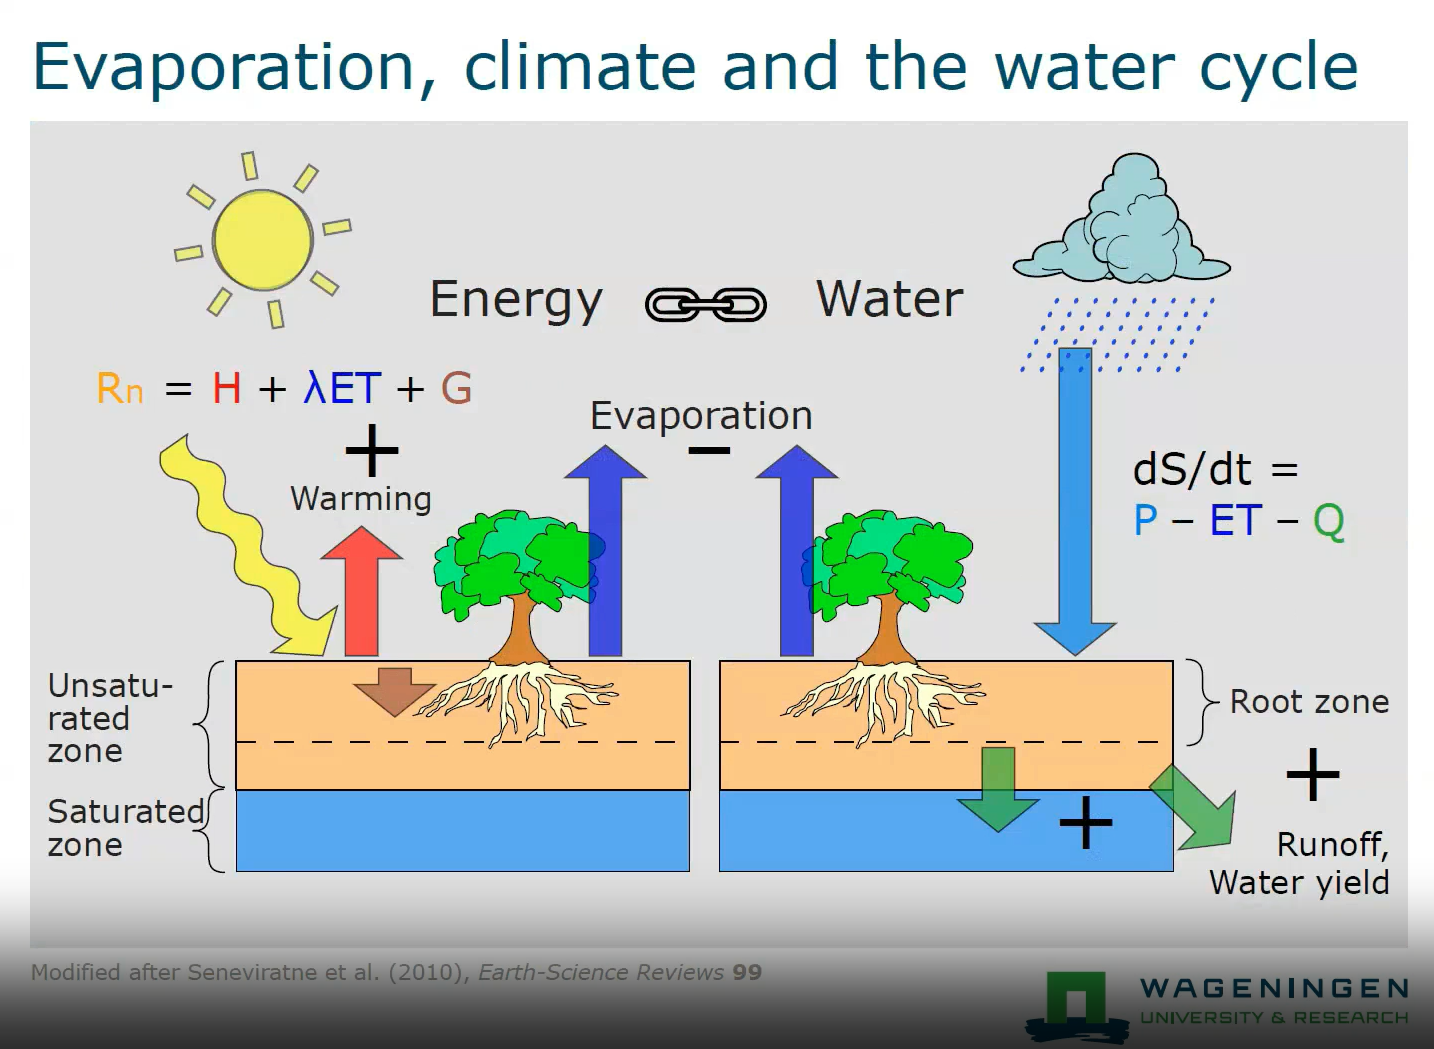
Ryan Teuling talks about soil moisture and land surface energy balance.
Heatwaves and droughts are often strongly linked due to the increased sensible heat fluxes at the land surface warming the atmosphere above. In this talk, I will discuss how soil moisture depletion changes the land surface energy balance, and how the evolution of changes in the land surface energy balance is different for different land cover types (i.e., forest and short vegetation). The use of high-resolution satellite soil moisture data for drought monitoring is also discussed.
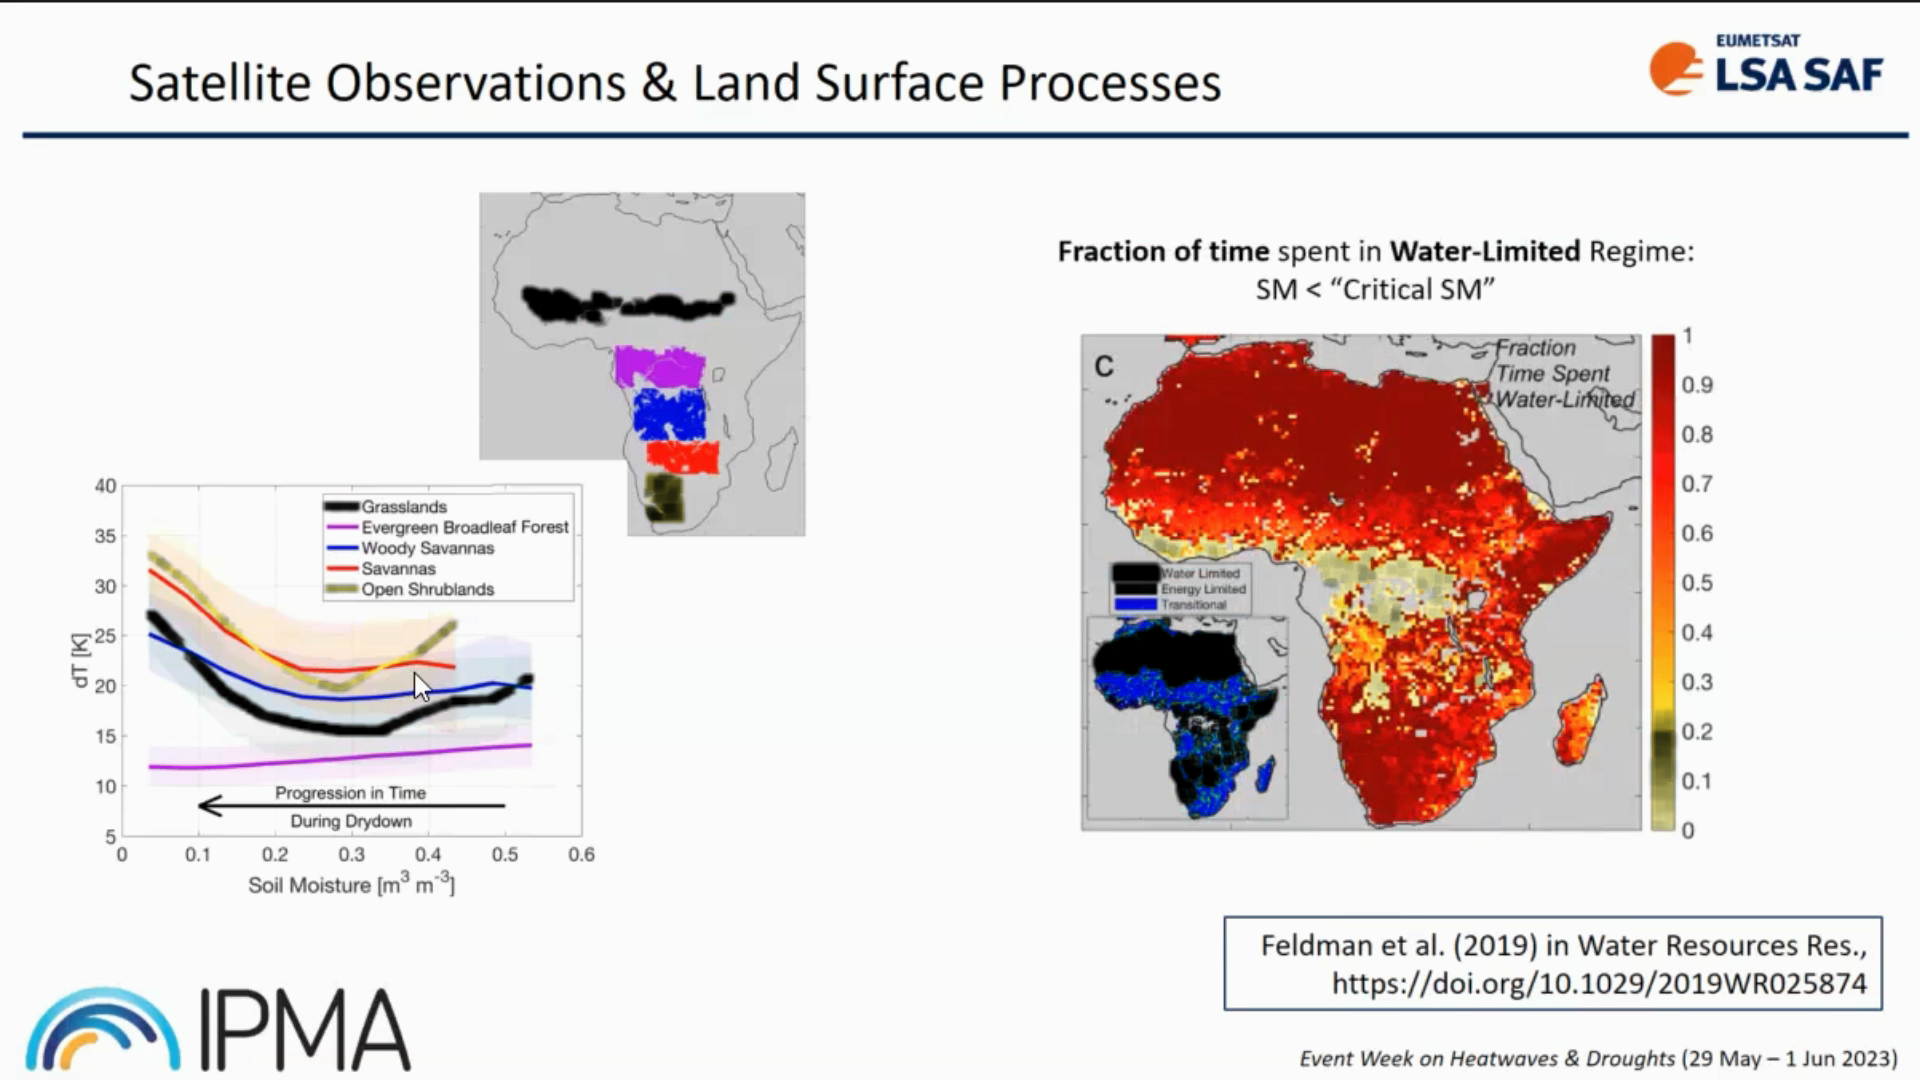
Isabel Trigo provides insight into LSA SAF datasets and its usage.
Heat and water stress leave clear signatures on land surface variables that can be monitored from space. The LSA SAF has been providing satellite datasets and products that allow the characterization of the surface energy budget and the monitoring of vegetation growth and stress. We will show that the combination of information on the surface temperature diurnal cycle and on vegetation state provides a different perspective on the spatial extent and time evolution of droughts and heatwaves, and reveals underlying soil vegetation-atmosphere feedbacks.
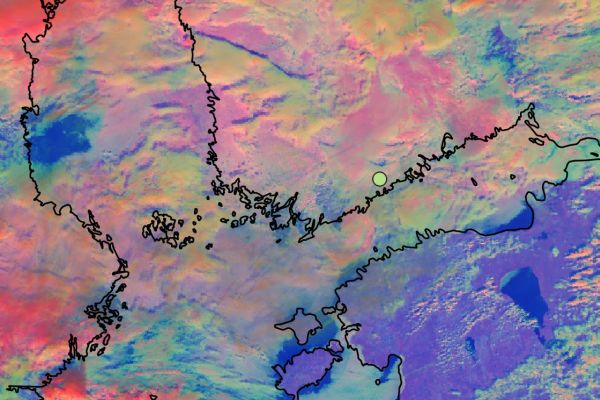
Pia Isolahtenmaki (stepping in for Robert Makitie) presents how FCI proxy data help in differentiating cloud types in low-cloud conditions.
On the 11th of September an almost stationary frontal system occurred over southern Finland leading to development of a large fog cloud over the Gulf of Finland and the Baltic Sea. The fog later moved slowly over southern Finland, where Finland’s busiest airport, Helsinki-Vantaa airport, is located. The fog cloud that occurred over the Gulf of Finland was hard to spot from SEVIRI images due to different layers of middle and high clouds. When thinking about the future, the question arises, would the FCI have spotted something more in this situation?
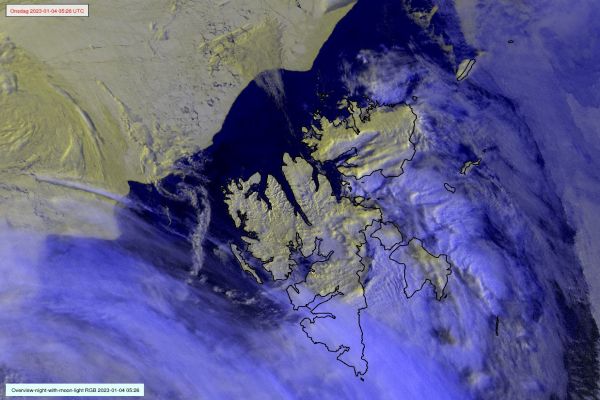
Signe Aaboe presents the data and software that OSI SAF offers to users.
Ocean and Sea Ice Satellite Application Facility (OSI SAF) was initialised in 1997 and is one of eight EUMETSAT Satellite Application Facilities, which provide users with operational data and software products from meteorological satellites.
The OSI SAF programme has a focus on the ocean-atmosphere interface and derives ocean products of wind, temperature, radiative fluxes and several perspectives of the sea ice. This presentation will give an introduction to OSI SAF, - what it is, who is involved, and which products are derived. The main focus will be on sea-ice developments and products.
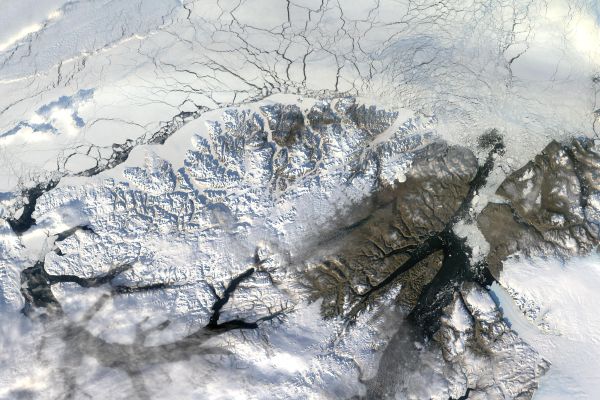
Jari Haapala explains how thermodinamical and dynamical factors affect the arctic sea ice characteristics.
The mass balance of the Arctic Sea ice depends on thermodynamical and dynamical factors. Thermodynamical and mechanical sea ice state variables are strongly coupled, but the strength of coupling varies in daily, seasonal, and climate time scales. When the ice pack is thick, solid, and compact, this coupling is strong and large areas of pack ice are mechanically connected. In these circumstances, the internal stress of pack ice accumulates and reduces differences in ice motion. In these conditions drift speed of the Arctic Sea decreases, the age of ice increases and the total mass of the ice pack increases. On the contrary, a thinner ice pack which includes cracks, leads, or larger open water areas is in turn mechanically weakly connected, exhibits larger variations in motions in shorter time and length scales drifts with higher speed, and exhibits shorter residence time in the Arctic. In this talk, the importance of ice dynamics on sea ice mass balance is reviewed and new findings based on the MOSAiC campaign are discussed.
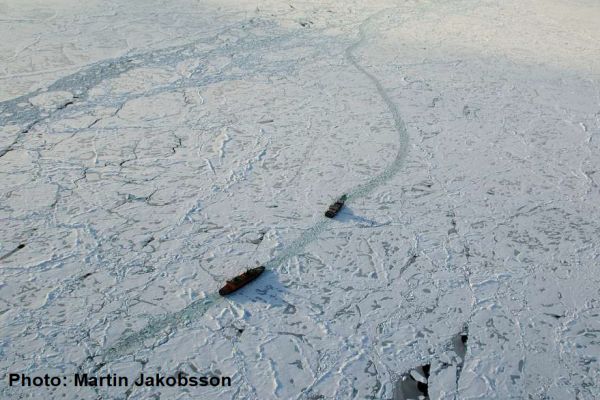
Patrick Eriksson speaks about monitoring sea ice in the very heavily trafficked Baltic Sea
The Baltic Sea, a relatively small semi-closed basin with brackish water, is one of the most heavily trafficked sea areas in the world. Thousands of vessels visit ice-infested ports every winter, which requires well organized icebreaking. To support this winter navigation operation, the Ice Service at FMI conducts monitoring and forecasting of the sea ice throughout the winter. An essential source of information is obviously satellite data. Imagery from several satellite platforms is not only processed to serve ice charting and reporting, but is also delivered in near-real-time straight to the bridges of the icebreakers. The dark and cloudy Nordic winter has proven the Synthetic Aperture Radar instruments (SAR) to be the most suitable when analysing the development of the sea ice. Different passive instruments are also used, light and cloudiness permitting. All satellite platforms bring their various strengths and limitations on the ice analyst’s desktop, causing constantly changing challenges to the charting of sea-ice features. So far, the analysis has been predominantly manual work, but the ever-increasing data volumes are setting a demand for AI-based automatic interpretation.
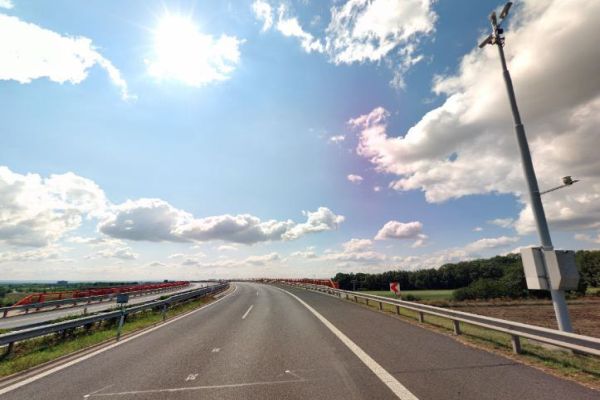
Vojtěch Bližňák presents how the satellite cloud data helps forecasting road surface temperature in Czechia.
The goal of the contribution is to assess an impact of extrapolated cloud cover derived from satellite observations on forecasts of road surface temperature (RST) performed by the road weather model (RWM) FORTE. Based on road weather station measurements and forecasts of the ALADIN numerical weather prediction (NWP) model, which are used as inputs to prepare initial and boundary conditions, the RWM generates a linearly continuous forecast of RST on selected Czech highways. The work will compare the evaluation of RST forecasts generated by two model runs using NWP and satellite-derived cloud cover estimation.