Weather events
In the previous sections the answers were found for the several reports of snow showers over the Sont and Baltic Sea (fig 3). For the evolution of the weather events it is interesting to have a closer look at the 12.00utc synoptic surface chart in fig 21. Only a few reports of present weather are found in the area: distant showers at the exit of the Sont, actual hail showers just off the northwest coast of Poland (see the red arrows) In fact these two weather reports are betraying a line of showers which is very good depicted in fig 23: the image of the 12.00utc weatherradar, supplied by the Danish Meteorological Institute DMI. It is obvious the line of showers still exists with smaller parts of higher intensity well displayed by the changes in the yellow colour (the darker the more intense).
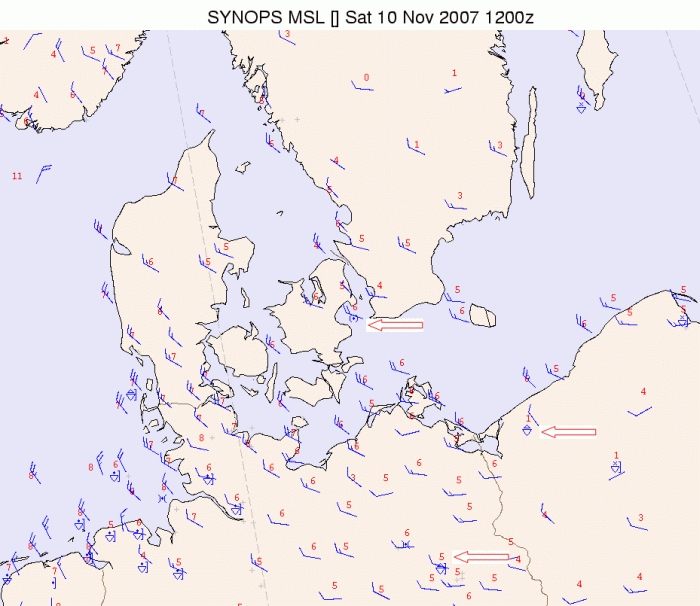
Figure 21: Synoptic chart 10 November 2007 1200UTC
It lools like an intensification of the convergence line due to coastal convergence, relative high surface temperature (+ 6 °C outside showers, falling rapidly to +10 only in showers), the arrival of the coldest upper air and the associated convergence - divergence pattern. With the synoptic information and the satellite information (see fig 24) the radar information is completing the overall picture on the weather events that took place in this case.
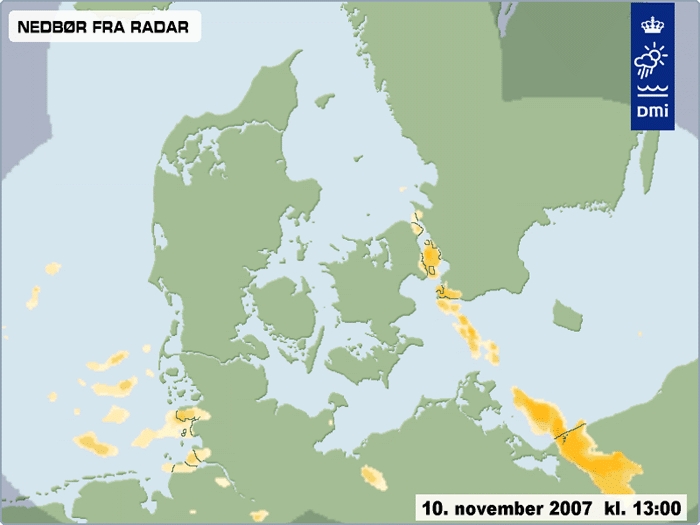
Figure 22: Radar image 10 November 2007 1200UTC,issued by DMI