Cloud structure in satellite images
Figure 2: Image from SAT24.com MSG, HR VIS 10 November 2007 1200UTC
When dry and cold air is transported over warmer seawater moisture is picked up. In fig 2 a northwesterly flow over Norway brings this air mass over Skagerrak and Kattegat. It takes quite a long time and distance for the humidity to increase and for the first CU clouds, later CBclouds, to develop. The line has several individual convective cells: large, small and well separated. Looking downstream from the north some smaller cells seems to coagulate into larger and wider area's with convection (over the Sont and near the northwest coast of Poland), but still with brighter spells in between. The process of updraft and downdraft, developing and decaying cells, is displayed constantly.
In the MSG IR10.8 (enhanced) - image (fig 3) detailed information about temperature is depicted. The anvils are less pronounced compared with the VIS image of fig 2. Brightness changes in white represent temperature changes at cloud top height: the whiter the higher the lower the temperature. Above a specific temperature white change into blue (T <= -40°C) for a better presentation of the highest and coldest tops, found over the northwest coast of Poland.
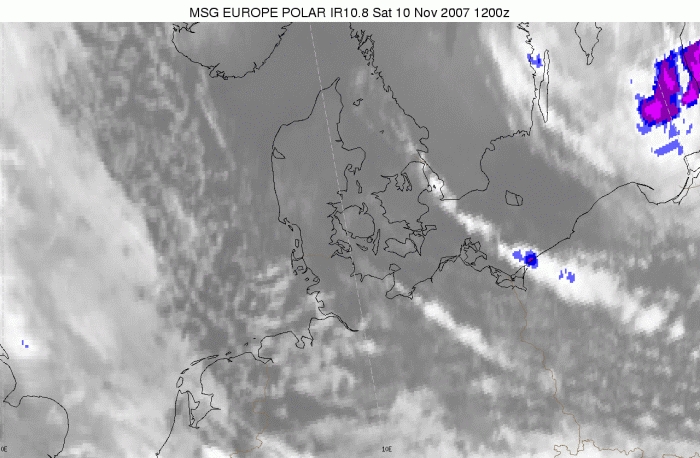
Figure 3: MSG IR 10.8, 10 November 2007 1200UTC
Another cloud street developed between Fünen (in the west) and Sealand (in the east, both Danish islands). These cloud-streets, noticeable on fig 4, HR VIS image of 09.00utc, develop at a much shorter distance off the east coast of Jutland, the western peninsula of Denmark. With hardly any change in instability (no change in upper air temperature at 700 hPa compared to the east part of Denmark, fig 6) higher air mass-humidity explains the earlier start of convection.
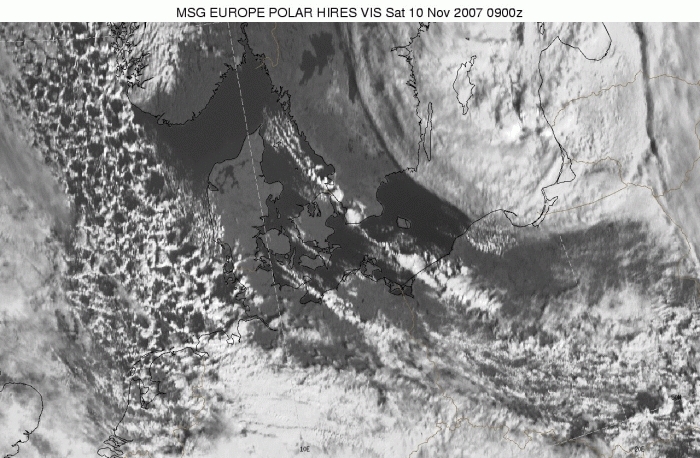
Figure 4: MSG image HIRES VIS 10 November 2007 0900UTC