Synoptic Situation
On the surface weather chart of the 10th of November 2007 0600UTC (fig 5) a large area of low pressure is extending from northern Norway into the eastern part of the Baltic Sea. On its west side northwesterly winds are advecting cold, arctic air from high latitudes over Norway and the northeast part of the Atlantic Ocean into the North Sea, Sweden, Denmark, Germany and Poland.
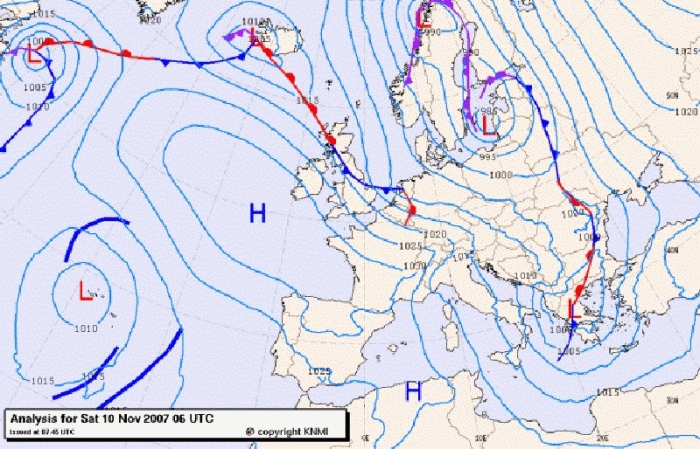
Figure 5: KNMI - analysis 10 November 2007, 0600UTC
From this general synoptic pattern we may expect, downwind of the Norwegian mountains a rapid decrease in humidity of this cold air. Weather over Denmark, Skagerrak, Kattegat, Sont and south part of Sweden is expected to be rather windy (see air pressure gradient) but fine. At the same time Open Cell Convection is present over the North Sea, west of Norway down to The Netherlands and into the German Bight.
Upper air analyses and forecast are useful in understanding the changes in temperature, wind, humidity and stability. Fig 6 is the analysis of 700 hPa with actual radiosonde data. The colour scheme of different temperature intervals is on the left side of the image. Notice the dark blue area with the lowest temperature range from -16° to -27°C together with very low Td values : -27° in Goteborg to -32° near Berlin. Dew points are much higher near Stavanger -21° and downstream to the German Bight (-17°).
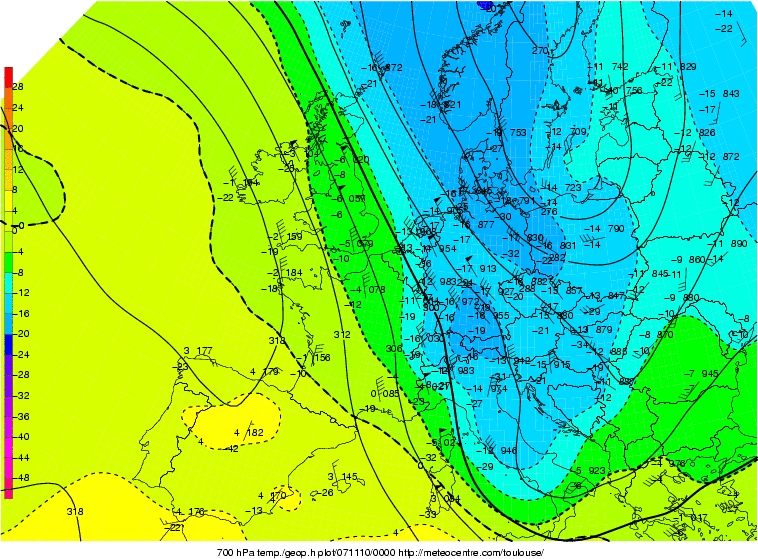
Figure 6: 700 hPa analysis 10 November 2007 0000UTC (meteocentre Toulouse)
Fig 7 is the skew T log P diagram of Goteborg at midnight on the 10th of November. Dry and cold air, a pronounced surface inversion with the highest observed temperature just above 0°C and just above the surface.
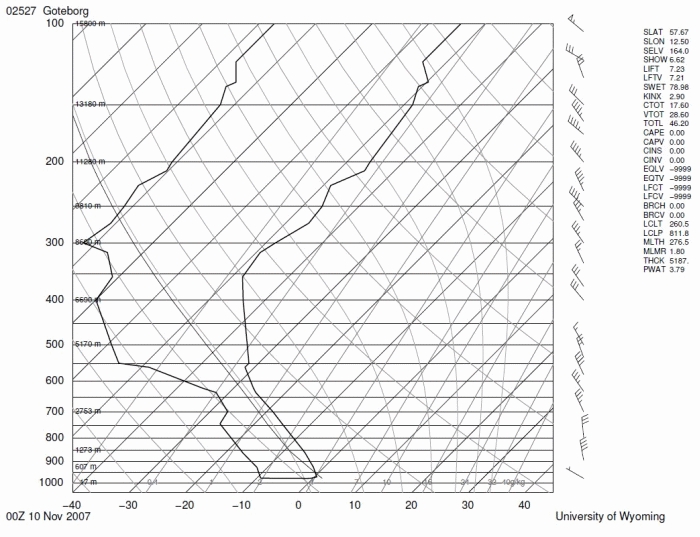
Figure 7: Skew T log P diagram Goteborg 10 November 2007 0000UTC
Looking at surface weather reports in detail (fig 8) some special observations attract attention over Kattegat and Sont. At the entrance of the Sont strong wind reports of 25 kt, at the same time much weaker wind from the west or southwest, about 5 kt only, over land. At the exit the surface wind is again increasing to 25 kt. It is understandable the wind speed inside the strait, over water, may reach the reported wind at the entrance and exit or even higher just downstream the entrance due to Venturi effects. The similar effect, stronger winds over sea and weaker over land, is noticeable in the coastal regions of other Danish islands and peninsula, the extreme west part of the Baltic Sea and the north part of Germany.
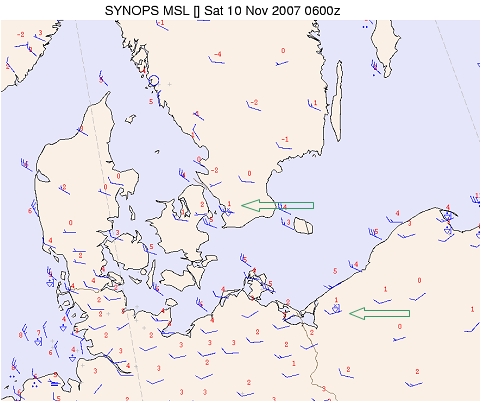
Figure 8: Surface chart 10 November 2007 0600UTC
The green arrows indicate reported weather out of the SYNOP - report from these weatherstations. With no help of satellite imagery one could think of a few, isolated snowshowers. But with image of fig 4 in mind these weatherreports are a reflection of the weather in the observed line of showers.
Over land, off the coast, temperatures dropped during the night under clear skies to values below zero ( -2 to -4°C). Over sea of course and in coastal regions, with onshore wind, air temperature stayed well above 0°C as over sea : +5 or +6°C.
Of interest of course is the temperature of the seawater TS. From the theory, described in the CM, it is know TS plays an important role in the process of cloud streets. In fig 9 the range of Ts, from MSG - OSI SAF, is displayed: from 11-13°C (light green) for the North Sea to 9-11°C (darker green) for the Danish waters and the Baltic Sea.
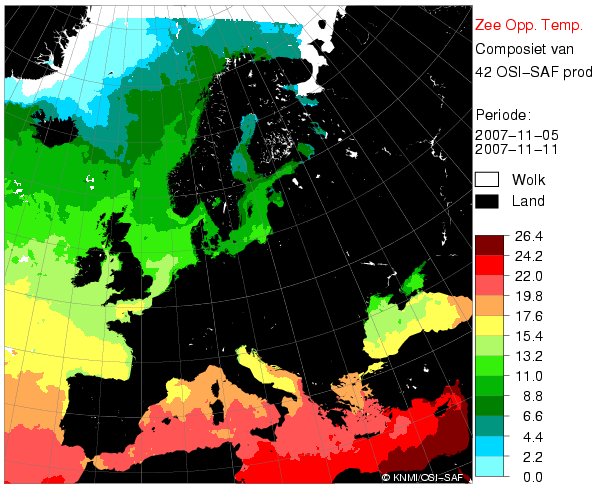
Figure 9: Sea surface temperature Ts, OSI-SAF 05-11 November 2007