Chapter VII: Snow water equivalent in the Baltic States based on satellite measurements
Table of Contents
- Chapter VII: Snow water equivalent in the Baltic States based on satellite measurements
- Satellite based SWE
- Validation of satellite based SWE
- Inter-annual variability of SWE
- Seasonal variations of SWE
Satellite based SWE
The snow water equivalent (SWE) describes the amount of liquid water in the snowpack that would be formed if it were completely melted. SWE is an important measure of availability of water resources, since it relates to the runoff of rivers and variations in groundwater levels.
SWE depends on the amount, depth and density of snow, as well as the age of snow cover. Around the Baltic States, snow cover thickness depends mostly on the monthly mean air temperature and precipitation during the snow cover accumulation period (January-February). Maximum snow depth can occur on the same day as maximum SWE or up to 2 to 3 months prior to maximum SWE. A decrease in snow depth may be an indication of settlement rather than melting in the snowpack. A decrease in SWE does indicate a melt (Farnes, 2013).
SWE can vary greatly between subsequent days due to temperature fluctuations or an influx of freshly fallen snow, so it is not possible to fill SWE data gaps using temporal filtering. Average maximum SWE in the Baltic States varies from 20 mm in the western coastal areas to 120 mm in the continental parts to the east (Fig. 1).
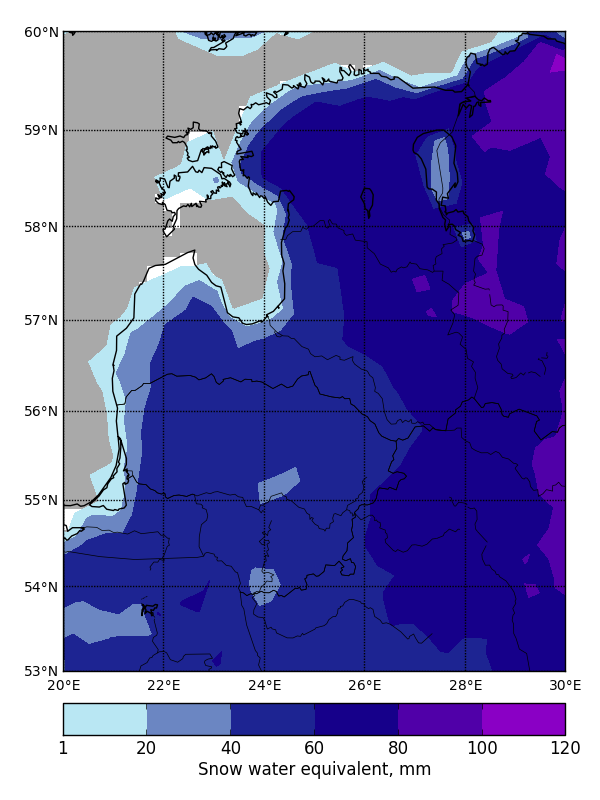 Figure 1: Average annual maximum SWE (mm) in the Baltic States, 2000-2013. SWE increases from the coastal regions in the west to the continental parts in the east.
Exercise 11
Choose the correct word to get the true statements about snow water equivalent. (Use the selection box to choose the answer that best completes the statement.)
Validation of satellite based SWE
Validation of satellite-based SWE can be done by calculating the correlation coefficient, root-mean-square error and bias. Contingency table statistics cannot be applied because SWE is not a nominal measure (yes/no event), but a quantitative measure.
Satellite-based SWE validation with ground data was performed at three meteorological stations in the Baltic States: Kuusiku (Estonia), Dobele (Latvia) and Vilnius (Lithuania) (Fig. 2). Statistical evaluation of the satellite data's accuracy varied between the regions and stations (Table 1). The largest bias (-4.1 mm) and RMSE (28.0 mm) were determined at Dobele. However, the sample size at this location was very small due to the gaps in ground measurements and satellite observations. Correlation coefficient between satellite-based SWE and in-situ measurements was 0.64 for Dobele, 0.80 for Vilnius, and 0.91 for Kuusiku.
 Figure 2: The meteorological stations which were used for satellite-based SWE validation.
Table 1: Summary of satellite based SWE performance over the Baltic States.
| Station | RMSE (mm) | Bias (mm) | Corr. Coeff | Sample size |
|---|---|---|---|---|
| Dobele, Latvia | 28,0 | -4,1 | 0,64 | 35 |
| Kuusiku | 17,9 | 3,7 | 0,91 | 79 |
| Vilnius, Lithuania | 11,6 | 4,9 | 0,80 | 85 |
Validation results indicate that GlobSnow-2 data has a tendency to overestimate SWE (bias in Vilnius was 4.9 mm and Kuusiku 3.7 mm). This overestimation may be related to the documented bias of GlobSnow project data to overestimate SWE under shallow snow conditions (Luojus et al., 2010). Figure 3 shows a comparison of the results of satellite-based SWE and ground measurements at the Vilnius meteorological station.
 |
 |
Figure 3: Satellite-based SWE performance compared to the in-situ data at the Vilnius meteorological station. On the left: scatter plots of SWE estimates. On the right: histogram of the differences. GlobSnow-2 product shows a tendency to overestimate the SWE value.
Inter-annual variability of SWE
SWE values vary from year to year depending on the depth of snow cover, fluctuations of temperature and precipitation. Figure 6.4 shows the multi-year maximum SWE variation based on in-situ and satellite measurements at Kuusiku (Estonia). There is a general agreement between in-situ and satellite data, but in some years GlobSnow-2 made overestimation (2001–2003, 2010–2012) or underestimation errors (2005, 2007). SWE values from 2001 to 2013 at the Kuusiku station varied from 0 to 150 mm. In 2007 and 2008 the winters were very warm in the Baltic region and permanent snow cover did not form at all. During these years there were no SWE measurements at ground stations (due to the absence of snow or very thin snow cover). Zero SWE values also were determined by satellite measurements (Fig. 4). 2011, on the contrary, was very snowy, air temperature during the winter stayed below zero and this led to the accumulation of a thick snow cover. The maximum SWE value at the Kuusiku meteorological station reached 140 mm in February 2011.

Figure 4: Time series of annual maximum SWE values at Kuusiku (Estonia) based on in-situ and satellite measurements.
Seasonal variations of SWE
Snow cover starts to form in November and melts in April in the Baltic region. At the beginning of the season SWE values are low (0–20 mm) (Fig. 5) because the snow is fresh and has low density. Later in the season, when average air temperature is negative (in January and February), the snow cover starts to build up and the snowpack becomes denser – SWE values increase to 30–60 mm (Fig. 5). The highest values of SWE are typically recorded in the second half of February, although on some years it may be in March. Exceptions are mild, changeable winters with frequent thaws, when the SWE depends mostly on liquid precipitation events with a negative or close-to-zero air temperature. SWE in the Baltic States follows a meridional distribution and the lowest values are observed in the western coastal areas, while the highest values are found in the continental eastern parts (Fig. 5). At the end of March or at the beginning of April snow cover starts to melt rapidly and SWE values decrease to zero.
 |
 |
 |
 |
 |
 |
Figure 5: Spatial distribution of mean monthly SWE, 2000-2013.
Exercise 12
Choose the correct statements about satellite based SWE climatology.
Correct answers are: a), d), e).