Chapter VI: Snow cover days in the Baltic States derived from satellite measurements
Table of Contents
- Chapter VI: Snow cover days in the Baltic States derived from satellite measurements
- General remarks
- Validation with ground-based data
- Inter-annual variation in snow cover days
- Seasonal cycle of snow cover
General remarks
Post-processed satellite data with filled gaps and validation scores to indicate the uncertainty can be applied for climatological analysis of snow cover. In this module Baltic States are used as an example area. Annual and monthly snow cover days (SCD) were calculated for the region using MODIS data from 2000 to 2013. In this study, a day with snow was considered when snow cover depth at ground stations was at least 1 cm. Monthly and annual SCDs are used in climatological studies to represent the local and regional conditions and shifts in snow cover due to the climate change. In hydrology SCDs and snow depth are used to evaluate spring flood conditions, and in agriculture to evaluate soil water recharge potential.
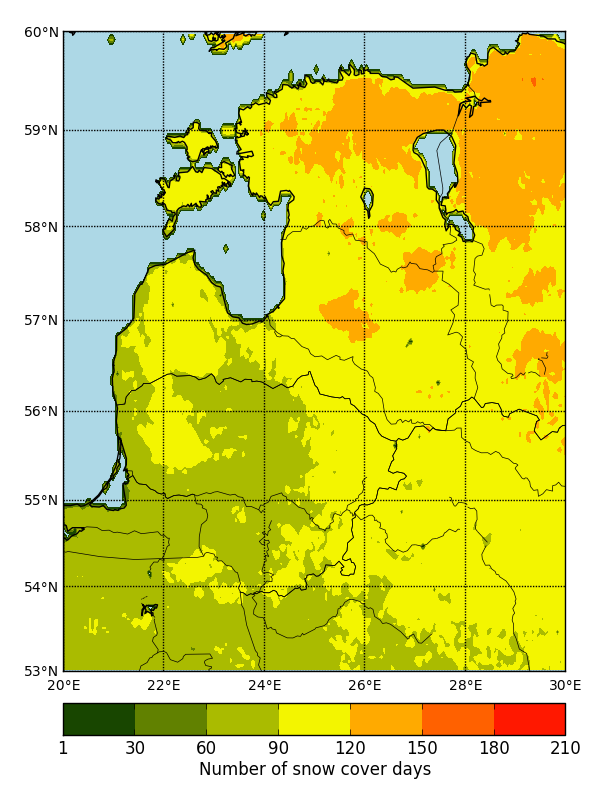
MODIS snow data composites suggest that the annual number of SCD varies from 30 days in the coastal regions of Lithuania and Latvia to 180 days in the north of Estonia (Fig. 1).

Figure 1: Average annual number of snow cover days in the Baltic states, 2000-2013. Derived from MOD10C1 product.
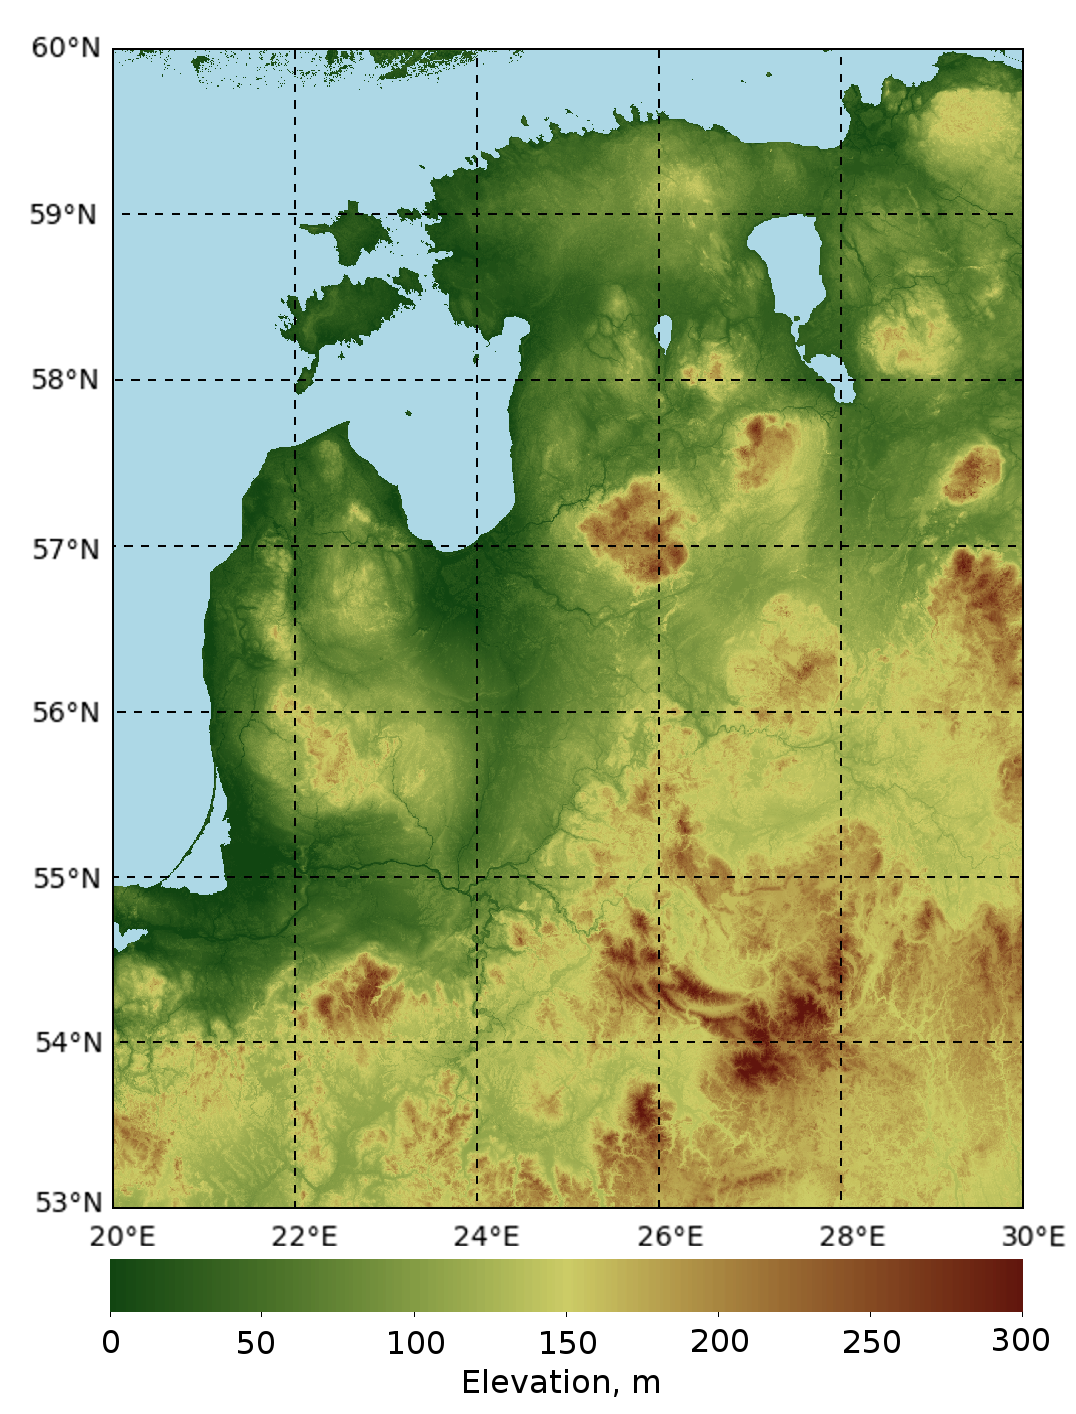
In Figure 2 it is clear that satellite-based SCD reflect the topography of Baltic States. The number of snow cover days in the region increases from west to east, as the climate becomes more continental. On a smaller scale, SCD occur more often at higher elevations than in lowlands. SCD maps based on in-situ data cannot match satellite-derived products in the detail of spatial information because of the limited number of in-situ observations. Spatial coverage is one of the main advantages of satellite-based climatology. Remote sensing of snow in mountainous areas is more challenging because of the complex topography and often very complex land cover patterns.
|
|
Figure 2: On the left: climatological mean of snow cover days derived from MODIS data. On the right: digital elevation model of the Baltic States. The spatial distribution of snow cover days reflects the transition from maritime to continental climate as well as topography; higher elevations have more snow.
Validation with ground-based data
Snow cover days derived from MODIS data (SCDMODIS) were validated with in-situ snow measurements at meteorological stations in Lithuania, Latvia and Estonia. There is no single statistical index which would describe all aspects of satellite data performance. Some indices (such as accuracy) are very sensitive to category which is the most common, while others (such as frequency bias) measure only relative frequency. Thus several indices should be used along to make valuable evaluation.
Comparison of annual SCDMODIS with ground data showed that MODIS tends to overestimate the number of snow cover days (Table 1). The correlation coefficients in the Baltic capitals were between 0.85 and 0.89, indicating good agreement between satellite measurements and in-situ data. The accuracy of SCDMODIS was 0.900.92, showing that most snowy days were determined correctly. The probability of detection (POD) at Vilnius and Tallinn was 0.830.85. At Riga it was 0.67, indicating that only 67 % of snow cover days observed in-situ were determined by satellite data. The threat score (TS) in these three locations varied from 0.61 to 0.72. This demonstrates that satellite-derived snow cover days corresponded well with ground-based observations.
One useful index for satellite-based product evaluation is Climatological Skill Score (SSclim). High positive SSclim values show an improvement over the climatological estimations based only on in-situ data. SSclim was high in Tallinn and Vilnius (0.71 and 0.79 respectively) and much lower (0.35) for Riga. Though SSclim values were low for Riga, MODIS is still better at determining snow cover than station climatological estimations.
Table 1: Statistical indices of MODIS-based annual SCD validation with in-situ data.
| Riga | Tallinn | Vilnius | |
|---|---|---|---|
| SCDinsitu | 89,2 | 111,5 | 93,1 |
| Mean absolute difference d, SCDMODIS SCDinsitu | 20,9 | 10,7 | 8,9 |
| Standard deviation | 15,4 | 8,0 | 6,8 |
| Correlation coefficient | 0,87 | 0,85 | 0,89 |
| Relative difference, % | 1,40 | -0,48 | 1,40 |
| SSclim | 0,35 | 0,71 | 0,79 |
| Accuracy (Hit rate) | 0,90 | 0,91 | 0,92 |
| FAR (False alarm rate) | 0,13 | 0,15 | 0,15 |
| POD (Probability of detection) | 0,67 | 0,85 | 0,83 |
| TS (Threat score) | 0,61 | 0,74 | 0,72 |
Exercise 9
Based on statistical indices in Table 1, at which location, overall performance of MODIS was poorest?
The correct answer is: a) Riga.
In Riga standard deviation and mean absolute difference is highest and POD, SSclim, TS is lowest. Riga is at the coast of the Baltic Sea and snow cover in winter is often ephemeral and frequent thaws makes hard to correctly determine days with snow cover using satellite data.
Inter-annual variation in snow cover days
There is large inter-annual variation in snow cover days in the Baltic region. The number of days with snow cover can vary by a factor of 4 from year to year (Fig. 3). Higher variation is observed in coastal regions since there are more winter thaws in a maritime climate and the snow cover is often ephemeral and patchy.
Figure 3 shows that the lowest number of SCDs in all three locations occurred in the winters of 2006-07 and 2007-08. The winters were exceptionally warm and in many parts of the region permanent snow cover did not form at all. Another exceptional winter was 2012-13 when the cold weather continued till the middle of April and in many locations the annual number of SCD was highest during the analysed 13-year period (Fig 4).

Figure 3: Comparisons of snow cover days at different meteorological stations. MS - in-situ measurements at meteorological stations, MODIS - snow cover days derived from satellite measurements.

|

|
Figure 4: Annual number of snow cover days. On the left: winter 2007-08; on the right: winter 2012-13. Annual SCD during these two winters differed by a factor of 4.
Seasonal cycle of snow cover
Snow cover in the Baltic States starts to form in November and completely melts in April. The number of snow cover days is higher in the highlands and lower in lowlands and coastal areas. In most years the snow cover is permanent in January and February, meaning it builds up and does not melt (Fig. 5). During these months the average air temperature is well below 0 °C. In the southwestern part of the region the snows begin to melt in March, but in the northern parts the snow cover persists. In April, when the average air temperature starts to rise, the snow cover quickly melts and can cause major spring floods. The highest average number of SCDs (510 days) in April is observed in the northeastern part of Estonia (Fig. 5).

|

|

|

|

|

|
Figure 5: Mean monthly number of snow cover days in the Baltic states, 2000-2013. First snow in the region falls in November; snow cover builds up through December and stays permanent during January and February. Spring melt starts in March in the southwestern part of the region and by the beginning of April snow cover melts everywhere.
Exercise 10
Please take a look at the image below and answer the following question:
Choose the correct statement why number of snow cover days in the areas marked with red differs from surrounding regions?
 Figure 6: Average annual number of snow cover days, 2000-2013
The correct answer is: c).
Number of snow cover days is higher in uplands.