C. Differences in grey shades
As discussed in the previous chapters, the water vapour content of the upper troposphere mainly depends on two factors: vertical and horizontal transport of humidity. The different shades of black and white in WV images correspond to the humidity content. Deficiencies in the model simulated horizontal WV transport result in differences between real and simulated WV imagery as discussed in section A and B. When vertical humidity transport is not correctly reflected by model physics, this will also result in differences of the grey shades between both data sources.
In summer season, vertical humidity transport is mostly convective. While most models process atmospheric instability quite accurately, they often fail to pin down the precise location of convective vertical transport. This may result in grey shade differences between real and simulated satellite images (figure 6).
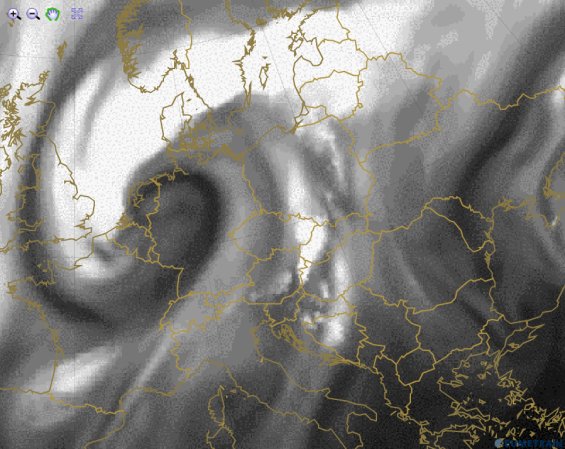
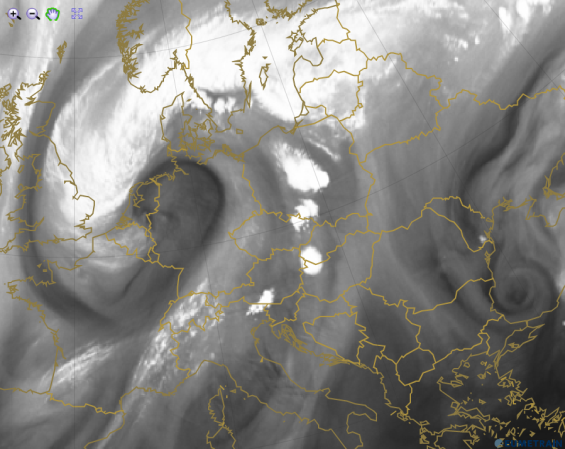
Figure 6a and 6b: Simulated (background) and real (overlay) WV 6.2 µm satellite image from 14 July 2011 at 12:00 UTC.
Differences in the images caused by over- or underestimated vertical humidity transport in the model are also frequent in frontal areas. This could be due to left exit regions not being correctly located or the front proving more (or less) active than predicted. The next images show an excellent example of underestimated vertical transport (figure 7a and 7b).
a) 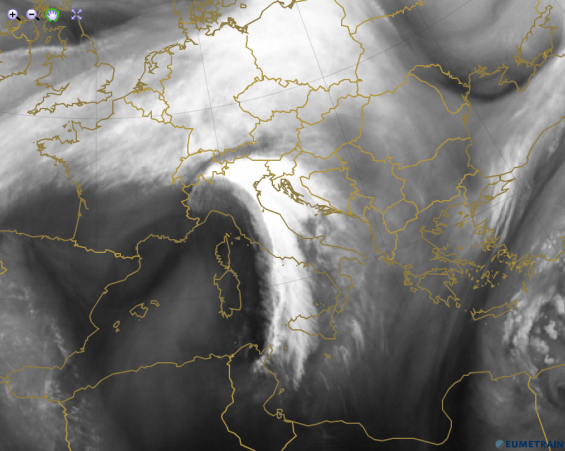 |
b) 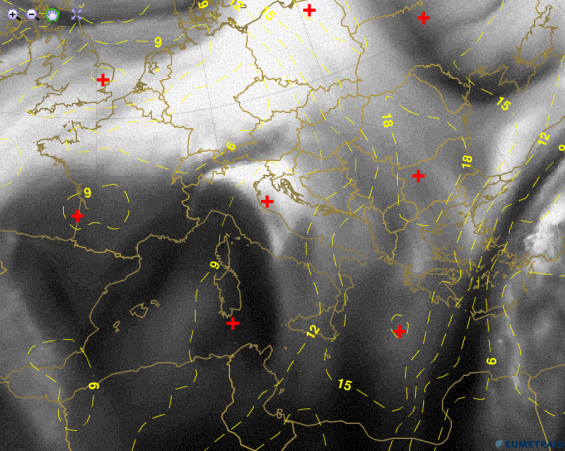 |
Figure 7a and 7b: Real and simulated MSG WV 6.2 µm satellite image from 23 December 2012 at 18:00 UTC. Showalter index (yellow lines) superimposed to simulated image.
Figure 7a and 7b show a comma-like structure formed in the lee of the Alps. Although this comma lies within an anticyclonic ridge in the model, the development of the high cloud structures seen in both IR and WV images indicates cyclogenesis on the lee side of the mountains. Model fields at 18:00 UTC do not resolve this process in its whole extent, just showing some lee cloudiness south of the Alpine crest.