B. Structures and sub-structures
In some cases, the model data may not be consistent with observations. This is most likely to happen over data-scarce regions like oceans, or in cases of very rapid developments, which were not taken into account at the model initialisation. The cases that are not visible in simulated WV images (while real WV imagery depicts them clearly) can be divided into two categories:
- Large structures (e.g. upper level lows)
- Sub-structures (e.g. frontal waves)
Also, it may be the case that simulated WV imagery shows features that do not exist in real images, as will be shown in the example below.
Example from 13 February 2013, 12:00 UTC
Figure 4a shows a real WV 6.2 µm channel image. A WV-eddy can be seen over the Atlantic at 56N and 38W (upper left image, red arrow). This feature of the upper troposphere cannot be detected in the simulated WV image for the same date (upper right image, figure 4b). This eddy is not contained in the model data of this specific model run. By contrast, the simulated WV image shows a pronounced bulge at the rear side of a cold front (green circle). This bulge is not present in real WV imagery.
The existence of this cloud bulge is also reflected in the model parameters. The comparison of real versus simulated WV imagery, combined with the field of relative vorticity at 300 hPa, shows a bend of the vorticity field where the cloud bulge of the simulated image is located (lower left image, figure 4c). This reflects the internal coherence of the model fields and explains why all other prognostic fields deviate from reality from there on.
a) 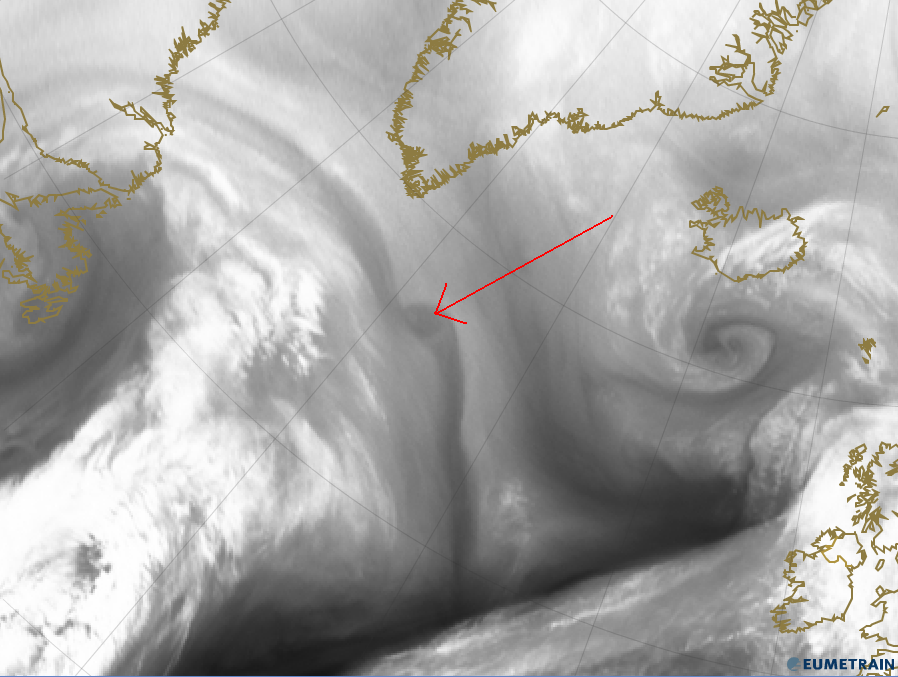 |
b) 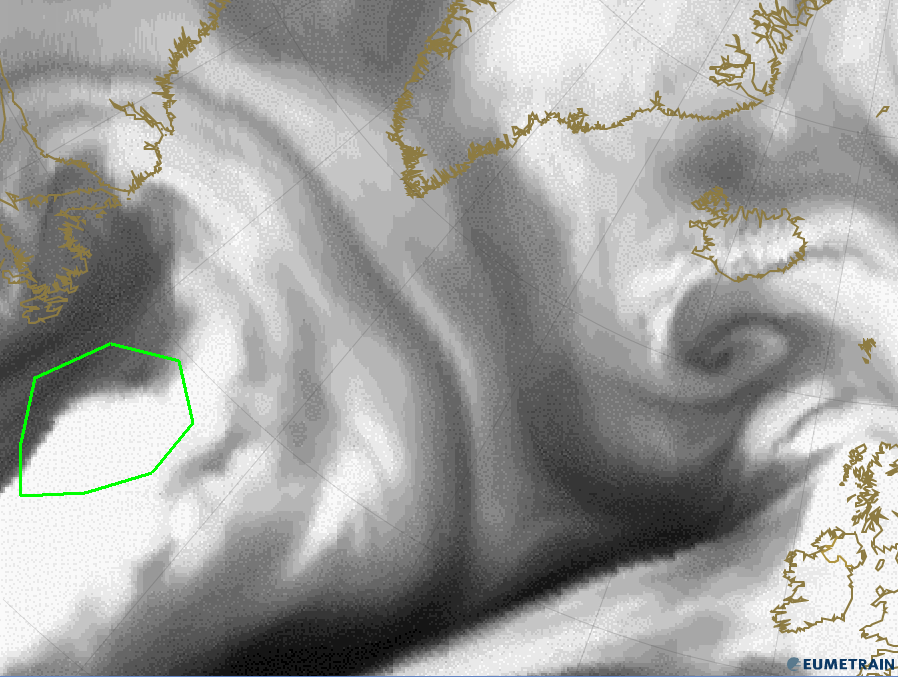 |
c) 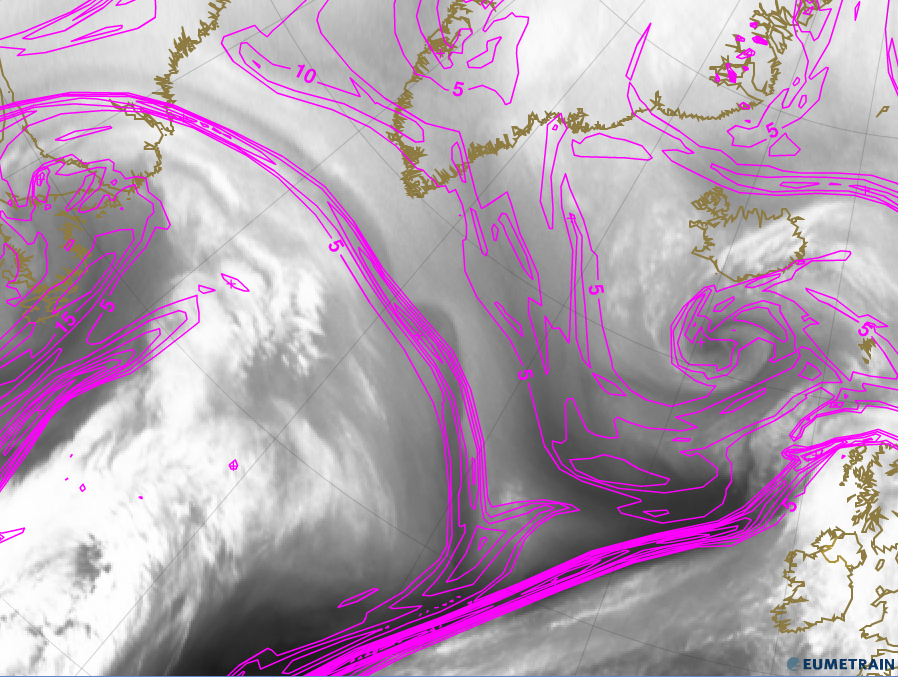 |
d) 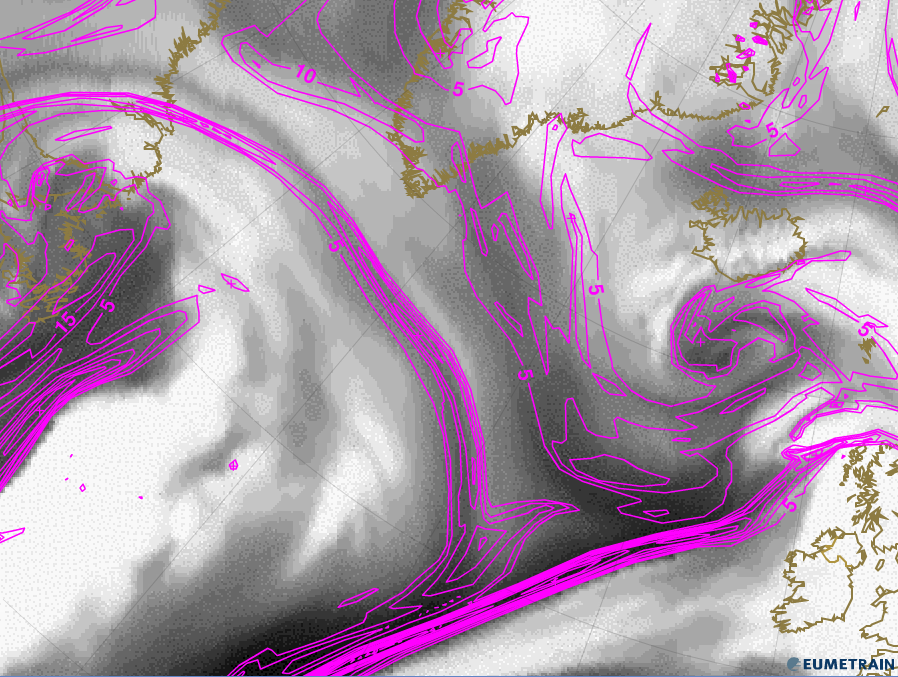 |
Figure 4a 4d: WV 6.2 µm images from 23 December 2012, 12:00 UTC
a) Real WV 6.2 µm image
b) Simulated WV 6.2 µm image
c) Real WV 6.2 µm image with positive vorticity and isotachs at 300 hPa
d) Simulated WV 6.2 µm image with positive vorticity and isotachs at 300 hPa
Example from 23 December 2012, 12:00 UTC
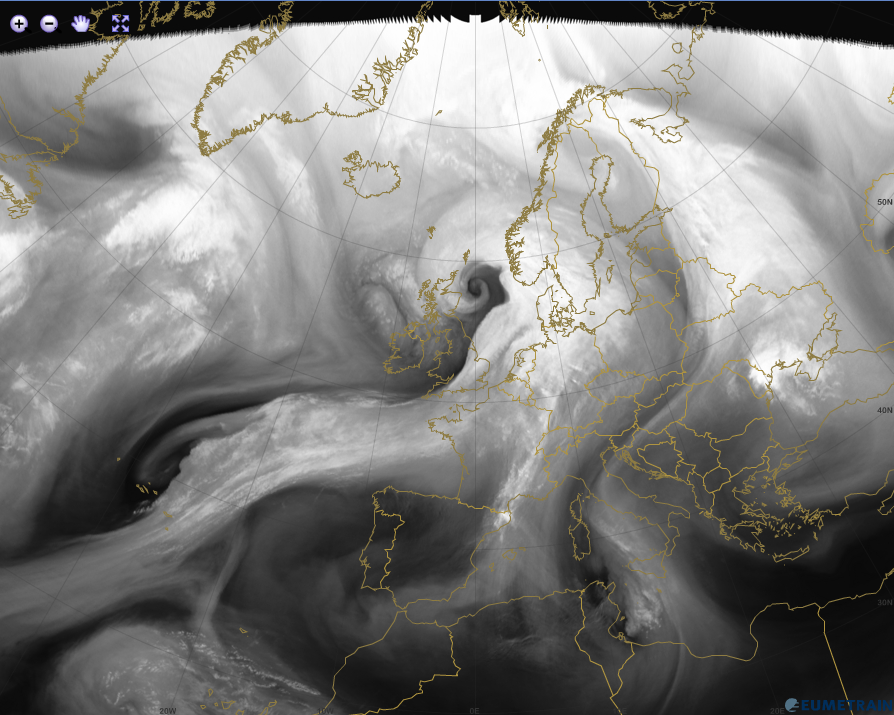
The WV image from 23 December 2012 (12:00 UTC) depicts a typical situation where a frontal sub-structure is not reflected in the model prognostic fields. An upper wave (UW) has formed over the British Isles, appearing as a light bulge within the cold front (figure 5a, red arrow). There is no such feature in the simulated WV image for the same date; instead, the rear side of the front shows a uniform curvature without extra bulges. Consequently, all other NWP parameters, like relative vorticity at 300 hPa or isotachs, follow the simulated WV image's idealized front line (figure 5c and 5d).
a) 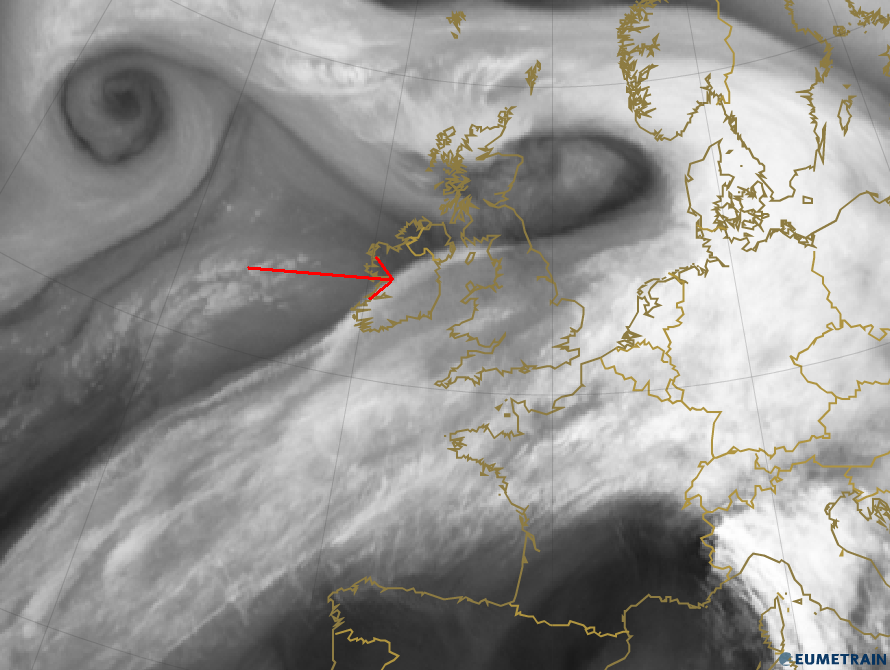 |
b) 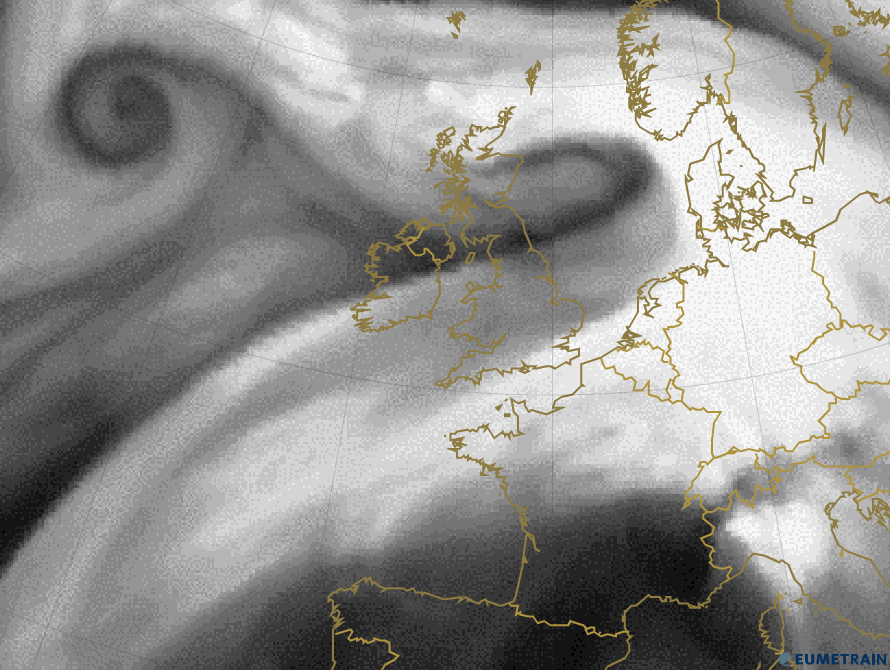 |
c) 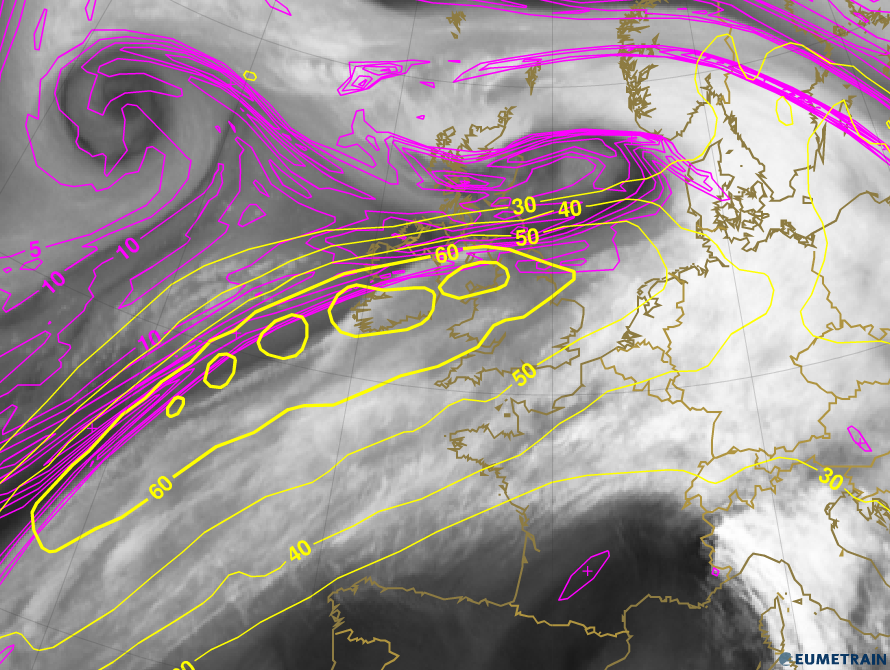 |
d) 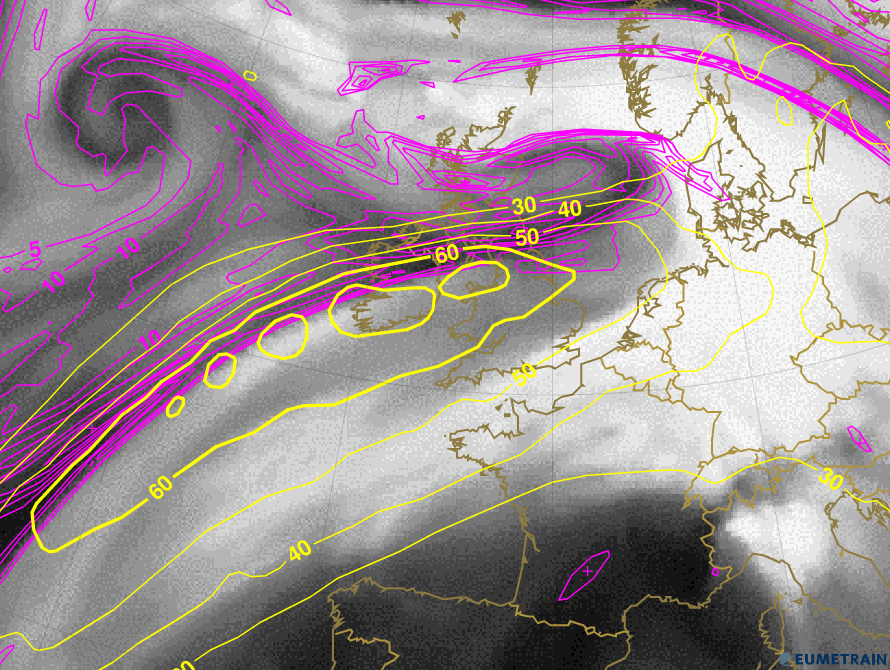 |
Figure 5a 5d: WV 6.2 µm images from 23 December 2012, 12:00 UTC
a) Real WV 6.2 µm image
b) Simulated WV 6.2 µm image
c) Real WV 6.2 µm image and positive relative vorticity at 300 hPa
d) Simulated WV 6.2 µm image and positive relative vorticity at 300 hPa
The above example clearly shows the shortcomings of prognostic model fields for frontal substructures compared to the real situation. While the large scale atmospheric currents are well reflected in ECMWF model fields, differences between forecast and actual data become visible in smaller scale features when comparing simulated against real satellite data. Comparing the two data sources in the same format allows a rapid cross-checking of the model’s coherence with observed data.
Question
Find synoptic relevant differences from real VW image in the simulated WV image.
REAL:
SIMULATED: Click on the image below in the region where you identify synoptic relevant differences: