The significance of jet streams for clear air turbulence
Jet streams are intense, relatively narrow, quasi-horizontal currents of wind that are accompanied by strong vertical wind shear. They are found at or near the tropopause. By definition, the wind speed is at least 30 m/s or 60 kt in a jet stream.
There is a strong relationship between the jet stream and the clear air turbulence. CAT is caused by the vertical and horizontal wind shear of jet streams. CAT is strongest on the cold side of the jet, next to and just underneath the axis of the jet.

Fig. 2.3: Polar front Jet at 300 hPa combined with isotachs 60 kt [DWD]
Figure 2.3 shows the geopotential at 300 hPa as narrow black isolines, the isotachs (in knots) of the jet as dashed isolines, the jet axis as a brownish line, and surface fronts.
There is a strong polar jet with a length of 8000 km and a width of 1000 1500 km.
The maximum of the wind velocity (jet streak or jet core) lies over southern Scandinavia
and has a maximum velocity of 180 kt.
The strongest horizontal wind shear and highest risk of CAT is found to the north
of the jet axis.
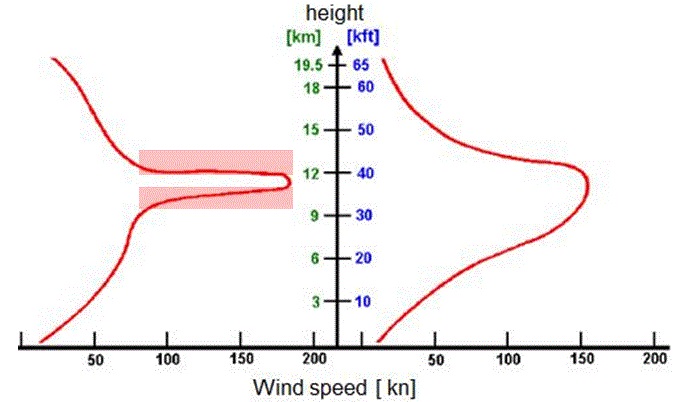
Fig. 2.4: The profile on the left represents a jet with strong vertical wind shear and a high risk for clear air turbulence above and below the jet core (red area). Wind shear and the risk of CAT are smaller for the profile on the right. [DWD]
The following animation 2.5 shows a winding polar jet stream. Wind velocity within the polar jet stream can exceed 300 kt. Here, the highest wind velocity is colored red; slower winds are blue.
Animation 2.5: Meandering polar front jet stream [NASA]
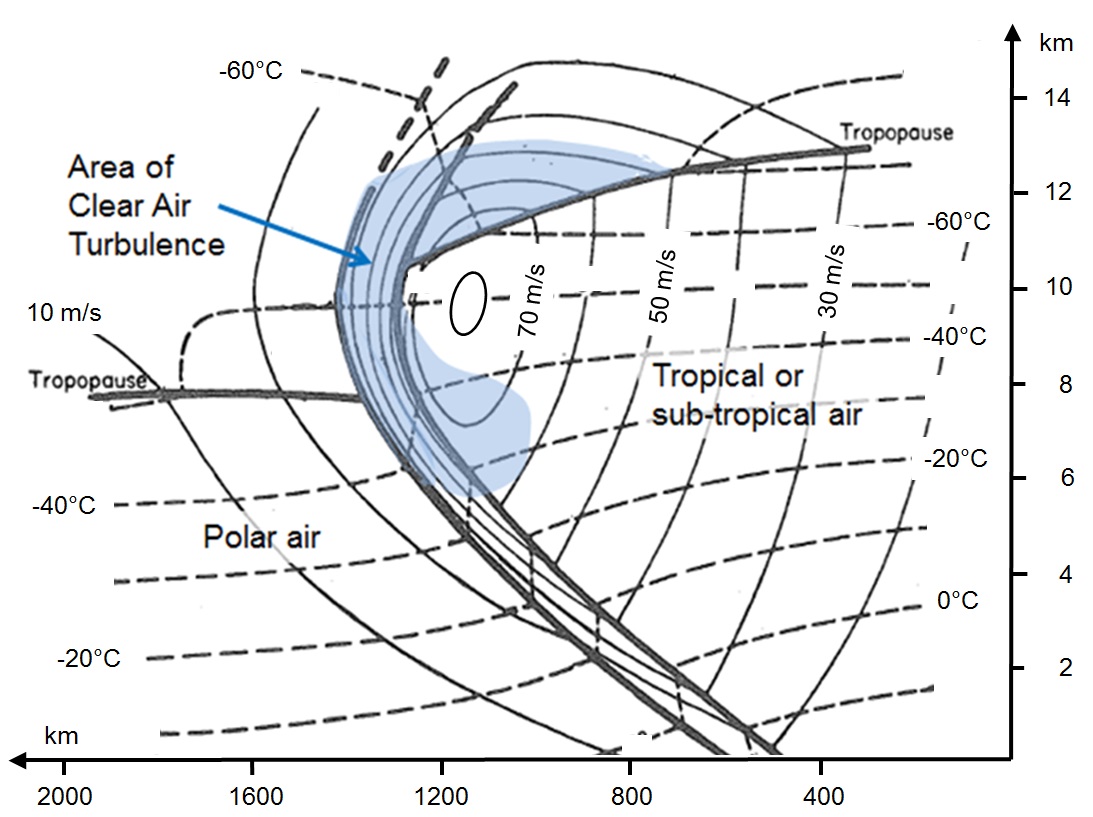
Fig. 2.6 Vertical cross section of a polar jet stream, showing the mid-latitude/sub-tropical and polar air, tropopause, isotachs (solid line, in m/s) and isotherms (dashed line, in degrees Celsius).
In Fig. 2.6 you can see with the blue areas that CAT is strongest on the cold side of, above and underneath the jet core. In this area we have a combination of a strong gradient of isotachs and high wind velocity.
On the cyclonic side of the jet axis you will find a lower tropopause with sinking dry air which could be of stratospheric origin. The border of the high cirrus clouds in the warm airmass and the lower clouds in the cold airmass will be a good indicator for the jet axis. You will find more examples in chapter III.