Chapter III: The fire hazard
Table of Contents
The Fire Triangle
As you have seen in the previous chapter, synoptic patterns are not enough to indicate the locations where forest fires are likely to occur and spread. In fact, aside from the weather, a fire's behaviour also strongly depends on fuel and topography, creating the three sides of what is usually known as the fire triangle (Figure 3.1).

Fig 3.1 - Fire triangle. Fire hazards are influenced by fuel, weather and topography.
In this third chapter the three sides of this triangle will be further explained. After answering the following multiple choice question the chapter will continue with "weather".
Question
Fire ignition depends most on which of the following meteorological factors:
The correct answer is D.
Lightning was the correct answer. However, most of the instances of ignition are not related to meteorological factors, but are mainly due to human activities such as barbecues, cigarettes, machines that burn due to overheating or arson.
Still, lightning is the primary source of ignition in wilderness and other remote natural areas. A fire ignited by lightning may propagate if no precipitation accompanies the event. For example, a study from 1931 for the Rocky Mountains states that 8% of the thunderstorms over that area are not accompanied by rain (Gisborne, 1931).
As mentioned above, the other parameters referred to are important, but for the fire's development rather than its ignition.
The Wildfire Alternatives project at the University of Arizona has shown through a logistic regression analysis that wildfire ignitions were spatially associated with the following factors:
- Proximity to roads - people usually access areas by way of roads and spend more time close to them than far away
- Location of campgrounds and picnic areas - people spend more time in these areas
- Proximity of urban areas - there are more people in urban areas, and less time is spent the further they have to go from the urban area
- Non-forested vegetation layers
- Urban-wildland border complexity (see Fig. 3.2)

In general, human-caused fires are more quickly reported and more easily accessed and extinguished than lightning-caused fires.
Weather
In chapter two we have already seen that temperature is an important meteorological parameter regarding forest fires. High temperature values near the surface, let´s say above 30ºC, promote fire spread, complementing the heat from combustion that results from a previous ignition. Other very obvious parameters are humidity and precipitation - fire and water are not exactly Romeo and Juliet.
So one could easily summarize that if precipitation occurs and humidity is high, forest fires are not likely to occur at all, right? But regarding important meteorological parameters, there is still one missing - the wind.
On an apparantly calm windstill day, all of a sudden a tree is struck by lightning and catches fire.
Due to the thunderstorm the wind increases as well. The effect of the wind on forest fires is basically to bend the flame and the column of hot air produced by the flame.
Heat transfer by contact and radiation then favors the heating of inflammable materials in the leeward direction, as depicted in the animation above, leading to the spread of the fire in that direction.
Question
Do you think the spread rate of a fire is larger for calm or stronger winds:
The correct answer is B.
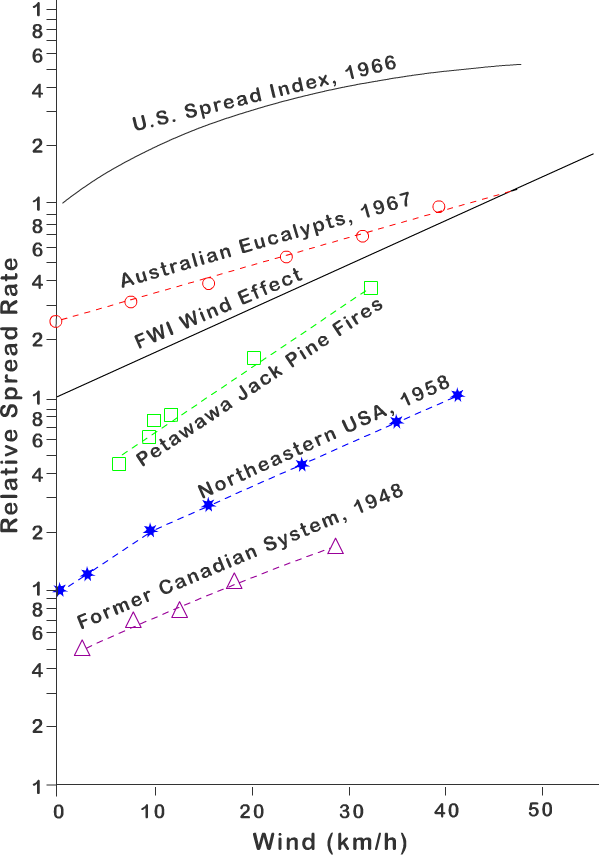
In Figure 3.3 you can see the results of several studies in Australia, Canada and the USA. The stronger the wind, the faster the spread rate. Note that the spread rate is in a logarithmic scale - so fire spread rate increases approximately exponentially with wind speed!
Question
After studying the previous chapter and paragraph can you now identify which meteorological parameters in the list below influence fire spread once a fire has started:
The correct answer is B.
If no precipitation has occurred recently, high wind speeds within a dry and warm air mass are the main ingredients for fire spread. Wind direction is also important for determining the direction of fire propagation, mainly in mountain areas. One rule of thumb regularly used by firefighters as a red alert combination is called the rule of the thirties:
- Air temperature above 30ºC
- Air relative humidity below 30%
- Wind speed above 30 km h-1
Of course, there is more to fire development, as you will see later in this module.
Up to now we have examined the importance of surface meteorological parameters on fire spread.
You have already seen that the risk of fire is lower in moist air than in dry air. However, fire spread and other fire characteristics are also connected to the meteorological conditions in the column of air over the area where a fire is occurring. In particular, stability plays a major role in the behaviour of the column of smoke (remember that destabilization of an air mass can be caused by low-level warming and/or high-level cooling). In fact, if the air is more unstable, the smoke column will reach higher levels (like clouds!) and produce stronger indrafts. Basically, an unstable environment may lead to an erratic development of the fire because of an unpredictable local wind field.
Furthermore, indrafts increase wind speeds and promote entrainment of more oxygen from the surrounding environment, therefore increasing the fire activity.
To see a detailed explanation for this behaviour we will have to look at the continuity equations.
The Continuity Equation
Let's consider the continuity equation, which is a mathematical representation of the conservation of mass (which, when applied to the troposphere, simply means that air is neither created nor destroyed):
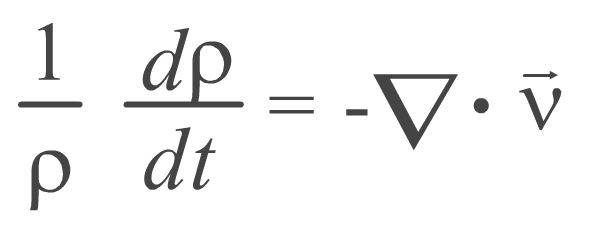
The term on the left-hand side represents the fractional rate of change of mass in a certain volume. The term on the right-hand side represents three-dimensional convergence or divergence.
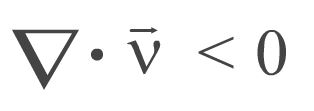
Therefore, this equation means that, assuming the mass is kept constant within a certain volume, an increase of the density:
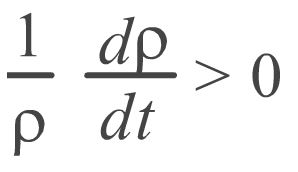
can only occur under convergence conditions:
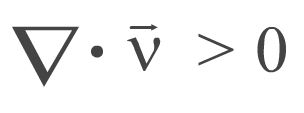
On the other hand, a decrease of the density:
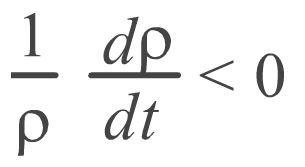
can only occur under divergence conditions:
Now consider the atmosphere to be incompressible, that is, the density of an air parcel does not change. In this case:
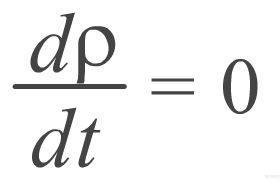

therefore, for an incompressible atmosphere, the continuity equation is simply:
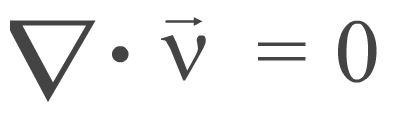
So, a non-divergent atmosphere explains why horizontal convergence forces vertical divergence. And vertical divergence means vertical motion if the horizontal convergence is happening close to the surface!
A study of northwestern Spain in 1997 showed that for dry air, the number of fires was higher if the troposphere was unstable, as this situation is related to an increase of wind speed at the surface, according to the continuity equation.
Curiously, in the same study it has been found statistically that for moist air (when there is less to worry about!) the opposite happened - the number of fires was lower with an unstable troposphere than with a stable one. The physical explanation for this apparent contradiction lies in the following:
For a wet environment, the horizontal convergence that occurs at the surface under unstable conditions is a "wet horizontal convergence". Therefore, it reduces the evaporating capacity of the atmosphere over the vegetation and prevents the drying of the atmosphere. In this way, a wet unstable atmosphere is the less risky situation for fires.
The same study also states that:
- Days more favorable for ignition are also more favorable for development.
- Days less favorable for ignition are even less favorable for development.
When a fire has been ignited, it generates its own circulation and humidity becomes the most important parameter for development (instead of the stability of the initial atmospheric column).
With this information, can you now order the following atmospheric conditions from lowest to highest risk of fire? (Use the dropdown menu to choose the answer that best completes the statement.)
So, to summarize, if a three-dimensional weather view is considered, an unstable dry low troposphere will be the worst scenario for a firefighter! Moisture is the key factor, so stable dry vertical profiles should be viewed as the next most hazardous conditions for a fire. Therefore, the two less risky conditions for fire involve moist lower layers. Now, remember that stability has been found to have a different significance for dry and moist conditions. Again, the risk is higher for moist stable than for moist unstable!
Fuel
According to a classification of Forestry Canada in 1992, fuel types can be organized in 5 major groups (Coniferous, Deciduous, Mixedwood, Slash and Open), with a total of 16 discrete fuel types. As you can see in table 3.1, each type is defined in terms of:
- forest floor cover (e.g. lichen) and organic layer (e.g. organic duff with 0-5 cm depth, uncompacted)
- surface fuels (e.g. very sparse shrub cover) and ladder fuels (e.g. tree crown extends to ground)
- stand structure (eg. fully stocked conifer plantation) and composition (eg. leafless)
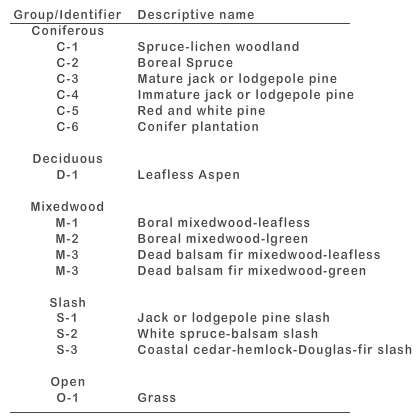
Table 3.1 - Fuel Types according to Forestry Canada (1992).
The given examples are simple for the benefit of those who are not foresters. One should be aware that the kind of vegetation should be accounted for, and that doing so is not simple.
One way of knowing how vegetation characteristics change from place to place and over time in a specific location is with a bird's-eye view using satellites.
The most well-known satellite product usually used to evaluate vegetation cover is the Normalized Difference Vegetation Index (NDVI). This index has been mostly derived from channel 1 (0.58-0.68 μm) and channel 2 (0.725-1.0 μm) of the NOAA satellite series. However, NDVI can be derived from any instrument with channels in the visible and near-infrared (NIR) parts of the spectrum, according to this general equation:
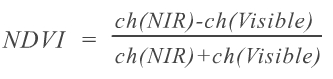
Infact, NDVI is based on the fact that pixels with dense vegetation have a stronger signal in the near-infrared than in the visible part of the spectrum, because green leaves have a reflectance of about 60% in the first case and less than 20% in the second.
Question
What NDVI values would you expect for an area with vegetation:
The correct answer is C.
0.5 is correct. In fact, you can expect the NDVI to range between 0.1 and 0.6 for an area with vegetation. On the other hand, clouds, water and snow have negative NDVI values as they have larger reflectance in the visible than in the near-infrared. Additionally, rock and bare soil have NDVI close to zero, as their reflectance is very similar in both visible and near-infrared.
Other satellite products also give information on vegetation status. You will see two LSA SAF products (EUMETSAT Satellite Application Facility for land, land-atmosphere interactions and biophysical applications):
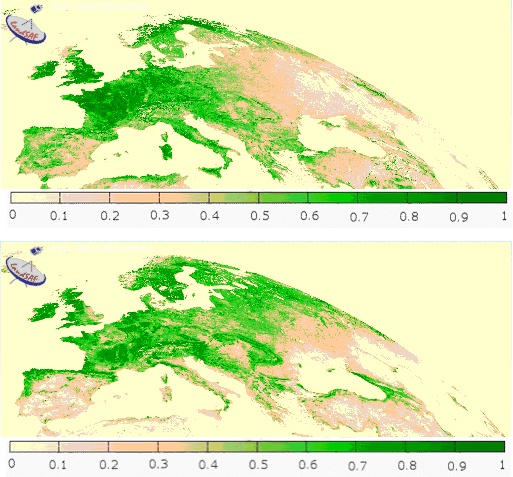
Fraction of Vegetation Cover
The Fractional Vegetation Cover (FVC) from Land SAF is a product derived for the MSG Seviri satellite channels. It gives the fraction of green vegetation per unit area on a horizontal surface. It is based on the different spectral signatures of vegetation and background on the MSG channels on the central wavelengths of 0.6, 0.8 and 1.6 μm.
In Figure 3.4 it is possible to evaluate FVC before and after the fire season of 2007, which mainly affected Italy and Greece. You can identify a drastic decrease in vegetation cover, to which fires have most likely contributed along with other reasons such as crops having been harvested or leaves drying out.
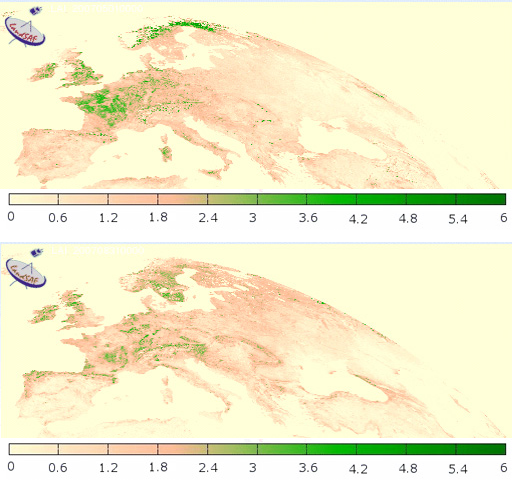
Leaf Area Index
The Leaf Area Index (LAI), also derived by Land SAF, is a dimensionless variable that accounts for the amount of leaves contained in a vertical column normalized by its cross-sectional area. It is derived from FVC, making use of parameterizations of the leaf albedo and the effect of canopy structure on radiation interception, which are dependent on the vegetation type.
Note that the decrease in vegetation that can be seen in the two images from May and August 2007 may not be completely related to the forest fires in Italy and Greece, as this period coincides with a natural decay of vegetation in these regions.
Topography
The effect of topography in the spread of fire is a very complex issue because topography itself is complex. Each case will always be an individual case and generalizations may be misleading. Nevertheless, based on experience, experiments and numerical simulations, one can state that in general:
- The rate of fire spread is higher in upwind slopes than in downwind slopes.
- Steeper slopes cause higher fire spread rates.
The effect of slope on fire spread can be seen in the following animation. When the angle between the flames and the fuel is decreased, the effect is pretty much like the effect of wind on flames. If, additionally, there is wind on a slope, then the rate of spread increases dramatically.
Results obtained from experiments on the variation of fire spread with slope can be plotted in graphics (see Figures 3.6 and 3.7).
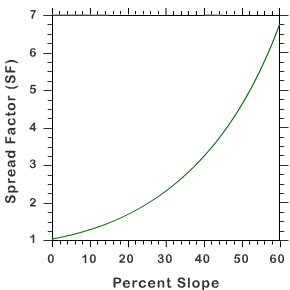
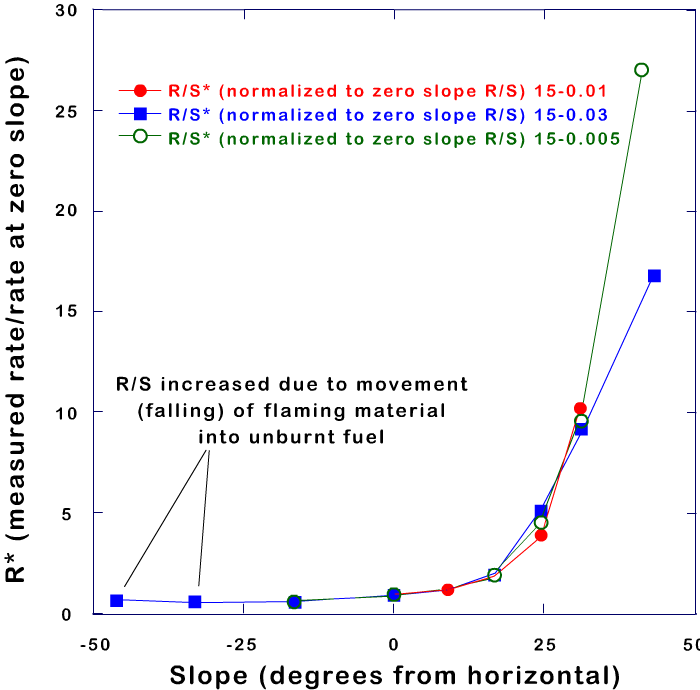
The graphics show that a fire propagates faster upslope if a terrain is steeper and that the spread increases dramatically for slopes greater than 10º. However, it also shows that the behaviour is quite different for a downslope fire propagation (negative values of slope):
- Fire spread has very low values!
- There is not too much impact of slope!
In fact, when a fire reaches the top of a hill, an increase in the fire spread rate is expected as winds are strongest there. However, when the fire advances to the lee side on the hill and starts to propagate downslope, there is a strong decrease on fire spread rate. This happens, not only because of the effect of (down)slope, but also because winds are weaker in the lee side (Forthofer, 2007).
Now consider the flow over a mountain ridge. Numerically this flow can be parameterized by the inverse Froude number:
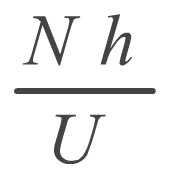
where N is the Brunt-Väisälä frequency, h the mountain height and U the wind speed.
Take also into account that if wind speed U is kept constant, this will result in a steeper mountain as Nh/U increases.
In numerical experiments (eg. Olafsson and Bougeault, 1996) it was found that for Nh/U > 1.4 (therefore for steeper mountains) most of the air mass that meets the mountain is decelerated and partly reversed (Figures 3.8 and 3.9).
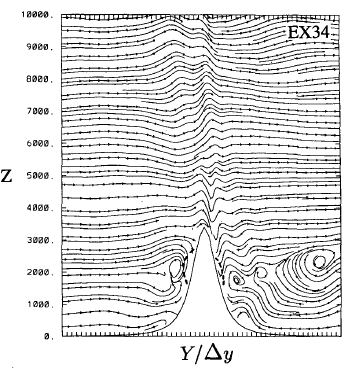
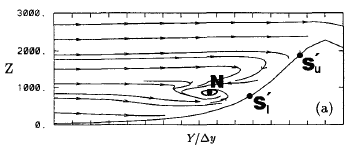
In fact, when there is an upstream blocking, streamlines computed in the numerical experiments clearly show the formation of vortices and the split of the flow in two parts: one part of the flow ascends the mountain and the other part returns and flows down the upstream slope.
Fig 3.10 - Gentle slope - the fire propagates faster up to the top of the mountain.
Fig 3.11 - The slope increases, the flow becomes turbulent and the down-slope wind of the vortices may slow down the propagation of fire up-slope
You can see that although many studies show that the upstream fire spread rate increases with increasing slope, you also have to take into account that rougher topographies may produce a change in the flow regime and lead to the creation of vortices and a reversal of the flow!
In fact, other studies stress that wind variability has a greater impact on the rate of fire spread rather than wind speed (Carrega and Fox, 2006). In particular, experiments show that at high wind speeds, a very turbulent wind creates a lower fire rate of spread!
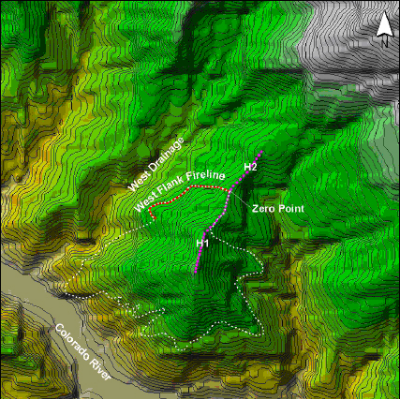
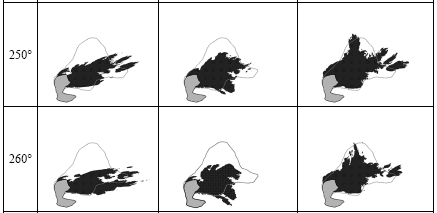
So, now you can understand why fighting fires in mountains can be so difficult - there are some rules, but topography will always reserve a veto! In fact, there are numerical models that try to reproduce in detail the spatial spread of a fire through a specific topography (see Figures 3.12 and 3.13).
Question
Now that you have read through many factors that contribute to the risk of fire, you may wonder how experts try to combine all the information.
The correct answer is B.
To explain the answer briefly: the first option is still currently in use, but one has to be able to interpret different kinds of information.
The second option is the correct option. For firefighting purposes a single index is the most desirable in an early stage, with the possibility of going deeper into detail if needed! One example of a single index is the Canadian Fire Weather Index, or FWI. You will learn more about this index in the next slides.
Finally, the last option is incorrect. Black box schemes are never desirable!
Fire Weather Index
The combination of factors into some understandable indexes that output a single fire risk when combined is a pretty reasonable solution. One of the most well-known indexes is the Canadian Fire Weather Index - FWI. In fact, outputting a single value for risk is what matters the most. If the risk of fire is high, it is not that relevant for firefighters (for practical purposes) which contributes more to therisk, the weather or the fuel.
FWI is made of surface observations at noon and represents fire danger at mid-afternoon. You will see that FWI is composed of individual indexes that give information on specific details. Let's see the meaning of each sub-index:
FFMC - This index classifies the moisture content of litter and other cured fine fuels, like needles or twigs less than 1 cm in diameter. FFMC is representative of the top litter layer 1-2 cm deep and has a short-term memory, only reflecting weather conditions that have occurred over the past three days (Figure 3.14).
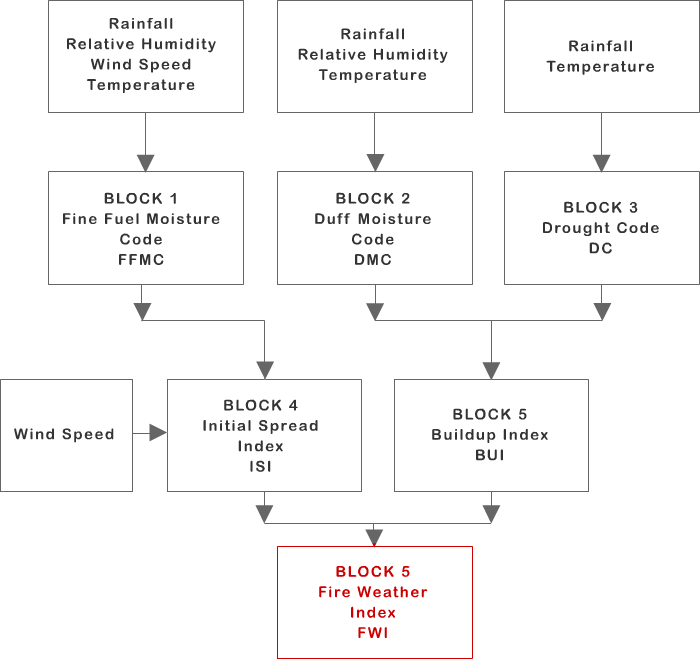
DMC - This index indicates the moisture content of loosely-compacted organic layers with a depth of 5-10 cm. DMC fuels have a slower drying rate than FFMC fuels and DMC may be used in predicting the probability of fire ignition by lightning.
DC - This third moisture index reflects the moisture content of compact organic layers, 10-20 cm deep. DC is indicative of long-term moisture conditions and deep burning fires, being related to mop-up and patrol difficulties.
ISI - This index combines FFMC and wind speed, being a good indicator for fire spread. Moreover, if the topography is known, the slope effect on fire spread may be converted into a wind speed equivalent and added to the real wind speed.
BUI - This index is a weighted combination of the DMC and DC indexes and represents the total fuel available for the spreading of fire.
As a conclusion you can say that FWI gives a single value for potential frontal fire intensity, combining the rate of fire spread with the amount of fuel being consumed.
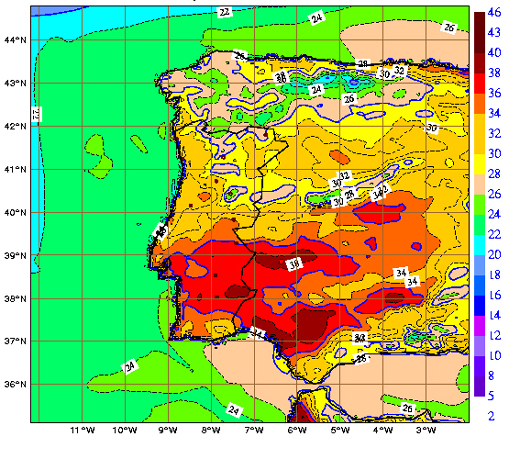
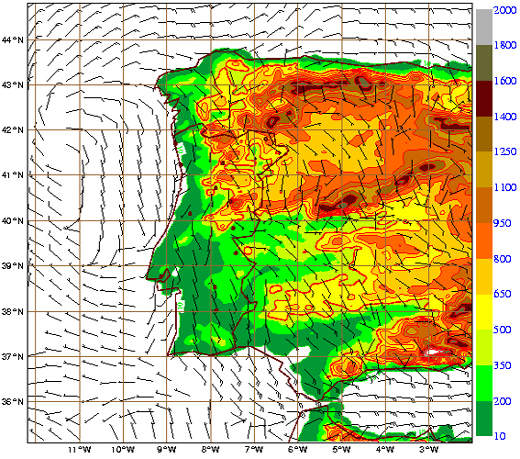
As an example, you can check the difference in patterns between the forecast fields of a limited area model (Figure 3.15 and 3.16) and the FWI index computed on the verification date (Figure 3.17). The forecast is for 12 UTC on 3 August 2003, which was the day following the aforementioned 2003 event. Thus we conclude that the pattern for forest fires due to weather parameters (FWI) differs from the single patterns for 2m temperature or 10m wind.
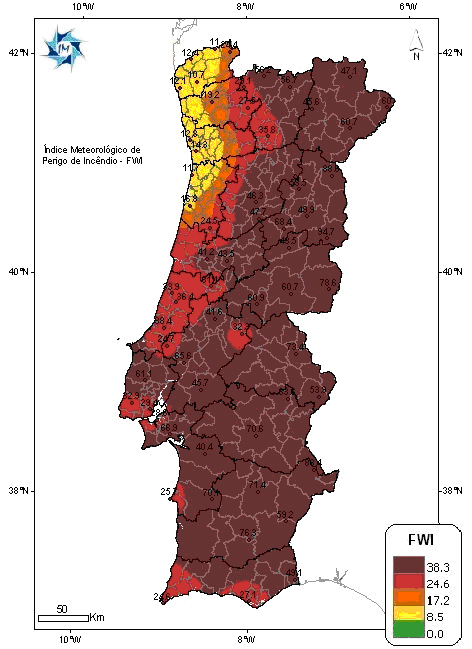
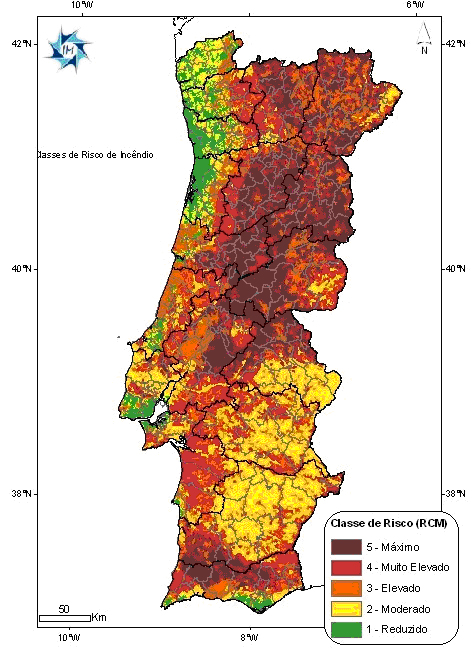
Furthermore, Figure 3.18 represents classes of fire risk that result from the combination of FWI with a structural map that remains constant throughout the year (and accounts for available fuel!).
If we look at the image from MODIS with the identified hot spots for this day (Fig. 3.19) we can conclude that it is quite consistent with figure 3.18; the locations where fires were identified match the regions with the highest risk for fire.

Maps of fire risk derived from satellite data are currently being produced in the LSA SAF project (the RFM product). This is a daily product that takes as input a satellite-derived LandCover map and Numerical Weather Prediction forecast data from the ECMWF (European Centre for Medium-Range Weather Forecasts) model. The main objective of the RFM algorithm is to compute daily values for the set of components in the Canadian Forest Fire Weather Index System (CFFWIS) for Mediterranean Europe, as well as levels of fire danger associated with the probabilitiesof fire occurrences exceeding specified magnitudes. The motivation for this is to provide the user community with information on meteorological risk that will allow for adopting the adequate measures to mitigate fire damage.
But you should be aware that, apart from FWI, there are other indexes being used throughout the world to identify fire risk.
FWI is an already complex index, but it can be used in even broader systems for national fire management. In Canada, for example, the system has been called the Canadian Forest Fire Danger Rating System (CFFDRS) and, besides the FWI index (which is the first major subsystem), it comprises a Forest Fire Behaviour Prediction System (FBP). This second major subsystem includes an extensive list of fuel types (Table 3.1), estimates for fuel consumption and fire intensity, and also provides comprehensive models for fire growth and crown fires - you will learn more about crown fires later on in this module.
Of course, there are also other complex systems currently in use around the globe using FWI or other indexes. You can see a short list of these systems below:
- The US National Fire Danger Rating System (NFDRS) with 4 main indexes: energy release component, spread component, burning index and ignition component. More information found at the main website Rocky Mountain Center Fire Weather and at Wildland Fire Assessment System (WFAS).
- The Australian Bureau of Meteorology system, with a Forest Fire Danger Index (FFDI) based on temperature, relative humidity, wind speed and a drought factor. The drought factor is state dependent: the Keech-Byram Draught Index (KBDI) is used in Queensland, Victoria and New South Wales; the Mount Soil Dryness Index (Mount SDI) is used in South Australia and Tasmania
- The European Forest Fire Information System (EFFIS).
- The Portuguese Meteorological Service System, with the computation of a Combined Index for Forest Fire Risk (ICRIF, Portuguese acronym). ICRIF combines FWI, a structural index and a vegetation index. The structural index is obtained from a land cover database (CORINE 2000), associating a specific risk weight to each of the 44 classes of land cover. The vegetation index is the NDVI, which you already had the opportunity to analyze before in this module. (www.meteo.pt, Bugalho and Pessanha, 2007).
The Canadian forestry serivces have been studying forest fire behavior comprehensively for decades, and if, after concluding this module, you still want to learn more on fire risk and fire behaviour you are strongly advised to take a closer look at these two documents in the references: Van Wagner (1987) and Foresty Canada (1992).
Summary
In summary, you have learned that fire spread depends not only on surface meteorological parameters like temperature, humidity, wind and precipitation, but also on the vertical profile of the troposphere. Besides meteorological factors, fires are also dependent on the topography of the area and the available fuel - that is, the kind and amount of vegetation. And finally, you have seen that all these factors can be gathered in fire weather indexes, which help in fire combat management!