Snow in Croatia
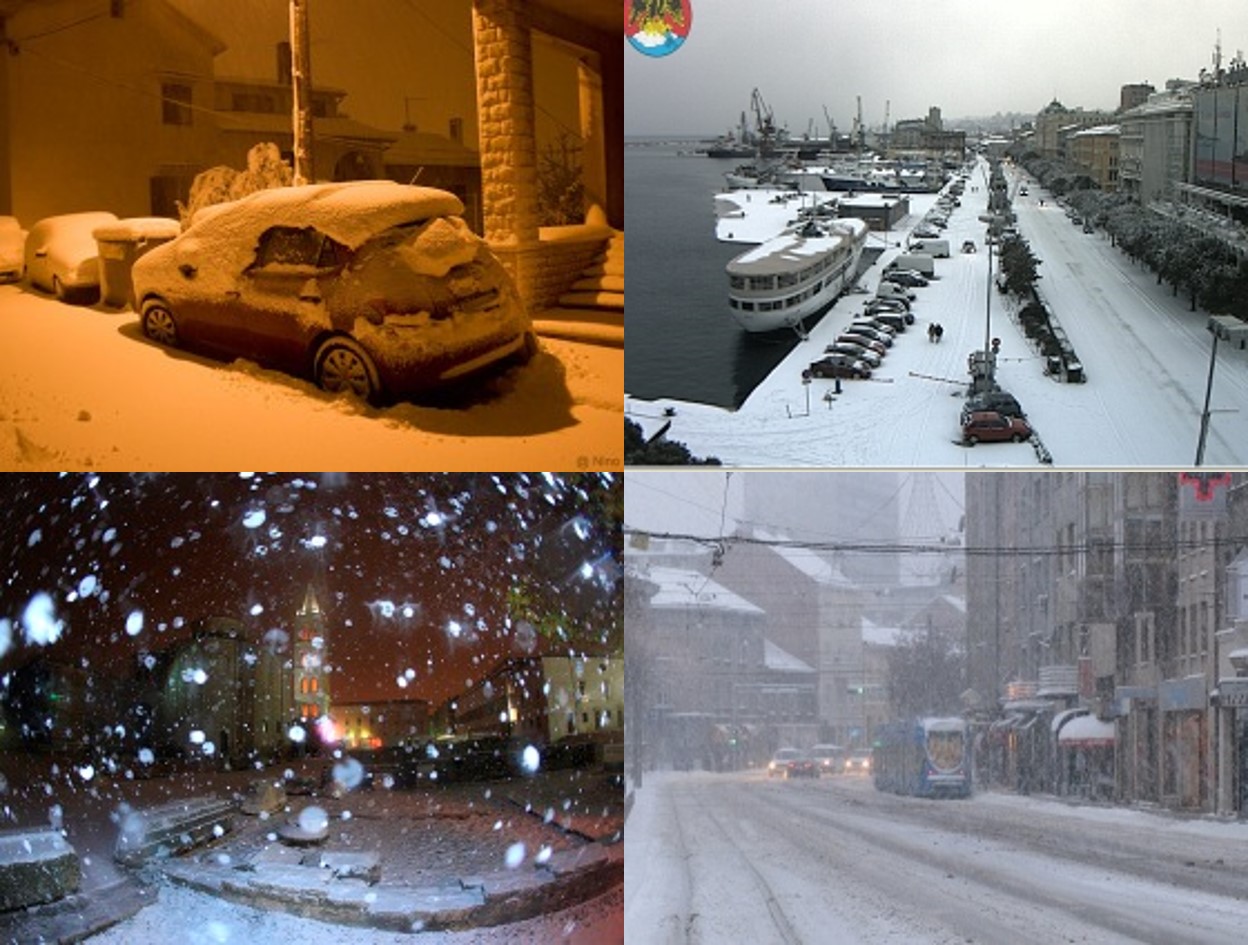
Figure 5.1: Snow and snow cover during 19 December in the north Adriatic, north-west inland and Dalmatia (clockwise: Pula, Rijeka, Zadar and Zagreb . Source: CROMETEO, http://www.crometeo.net/site/index.php)
In this part of the study we will concentrate on the weather situation on 19th and 20th December in the southern part of Europe, especially in Croatia.
Due to strong cyclonic activity the precipitation in Croatia was also very frequent in the period before 19th December, mostly from 14th on. In the beginning it was raining on the Adriatic coast and only light snow was falling in the inland. With temperature around 0°C the snow was melting. Advection of cold air from the northeast and north, described in the previous chapters, caused temperature drop and consequently more snow. This resulted in the increasing of snow cover in the inland and occasional snowfall at the North Adriatic coast.
A relatively huge amount of snow in a short time period at the North Adriatic as well as the accumulated snow in the inland, accompanied with extremely low temperatures, was associated with the weather situation on 19th and 20th December.
The snow episode brought the first snowflakes after midnight on the 19th December in the southern part of the Istria peninsula, which is not very common. Snow measurements on the local weather stations in Pula (airport and the city) in the morning showed 15 cm of fresh snow. Besides in Istria, traces of snow were recorded on the most islands in the north Adriatic, as well. At the same time in the village Maslinica on the Šolta island huge waves (7m high, according to an eye witness) damaged the waterfront and electricity piles.
In the inland of Croatia snow cover was also recorded on the 19 December, there was between 10 and 20 cm of fresh snow. At some stations in the highland snow cover was thicker than 60 cm and in the lowland it was between 20 and 30 cm. Clear night, snow cover on the ground and very strong cold advection resulted in extremely low temperatures in the morning of 20 December.
In the subchapters you can find the explanation of the synoptic situation, presented by means of the satellite images and a variety of basic ECMWF numerical fields. This combination can help you understand the genesis of the cold air outbreak and the origin of snow in Croatia which is different from the one described in previous chapters.
Upper-level low moving south - Cyclogenesis in Genoa Bay
At 00 UTC on 18th December a broad low over the Mediterranean and West Europe, with two centers - one over France combined with an upper-level low and the other over Greece and south Italy, can be seen in Fig 5.2. In the upper levels (at 500 hPa) the most striking feature is a zone of strong pressure gradient between the low over Europe and the high over the northern Atlantic. At 500 hPa there are two lows - one over Poland and Czech Republic and the other over the northern France.
The latter, earlier situated more to the north east, was the one responsible for the snowfall in the Netherlands.
In the next 24 hours that upper-level low moved southward. The other one over the Central Europe spread and deepened and at the end of the day there was only one broad low over Central Europe, with a trough axis extending towards Genoa Bay. During the same time in the lower level (1000 hPa) the low over Greece moved toward the Black sea. At the end of the 18th December (18 UTC) the Genoa low started to deepen and during the 19th December it moved across the Adriatic Sea further to the east.
The upper-level low moved to the south, towards Genoa Bay and north Italy and at the end of the 19th it was situated over Austria, Slovenia and Hungary. During that period the surface low and the upper-level low were not co-located which can be regarded as an indication of the ongoing cyclogenesis.

Figure 5.2: ECMWF Geopotential Height 1000 hPa (magenta) and 500 hPa (green), from 18 Dec 00 to 20 Dec 06 UTC
During the 18th December the strong north-easterly flow, most pronounced over the British Isles, as well as north-westerly flow over the Iberian peninsula brought very cold air over the Mediterranean. (Fig 5.3).

Figure 5.3: Meteosat 9 IR10.8 image overlayed with temperature advection at 700 hPa (red-warm advection, blue-cold advection), from 18 Dec 00 to 20 Dec 06 UTC
At 06 UTC a cold advection maximum reaches France and the second maximum is spreading over the eastern Mediterranean. At 12 UTC a strong northerly flow is still persisting over the British Isles, on the leading side of the extensive blocking high with center over Iceland and Greenland. The cold air reached the Mediterranean on the back side of the extensive and deep low with center over Central Europe. The upper level low at 500 hPa has moved southwards and at this point a cloud spiral is clearly seen over France. (Fig 5.4)
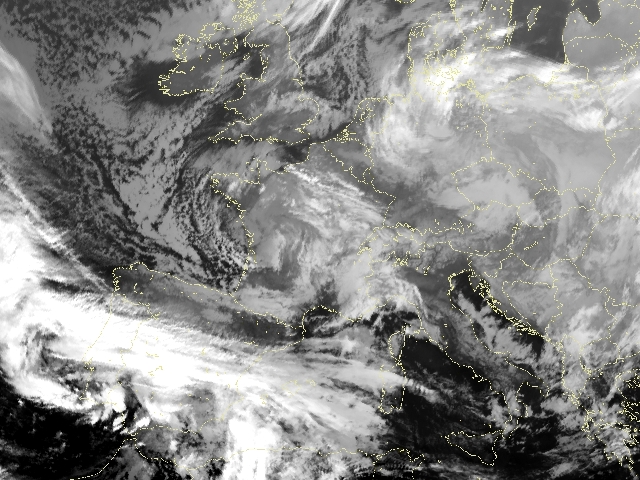
Figure 5.4: Meteosat 8 IR 10.8 image, 18 Dec 12 UTC
In the next 12 hours the situation has rapidly changed. A strong westerly wind caused the low to move to north Italy, followed by a pronounced maximum of cold advection. The most important feature at this point is the presence of a warm advection maximum upstream the maximum of cold advection. This warm advection will be responsible for the formation of the cloud head. The strong dipole of cold and warm advection over Genoa Bay and the north Adriatic is a sign of the ongoing cyclogenesis.
At 00 UTC on 19th December the formation of the cloud head within the maximum of warm advection is seen over the north Adriatic. (Fig 5.5)
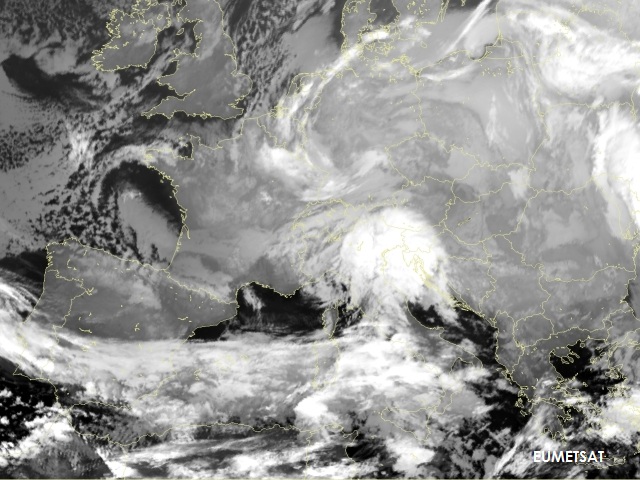
Figure 5.5: Meteosat 8 IR 10.8 image, 19 Dec 00 UTC
Very strong rising motion due to positive vorticity advection maximum in the left exit region of the jet streak intensified the process. (Fig 5.6)

Figure 5.6: Meteosat 9 IR10.8 image overlayed with isotach at 300 hPa (yellow) and PVA300 (orange), from 19 Dec 00 to 20 Dec 06 UTC
Cyclogenesis in Genoa Bay resulted in heavy snowfall as recorded over north Italy and Istria in the northern Adriatic. The low over Italy and the north Adriatic was pronounced only in the lowest layers. In the upper levels the situation was characterized by the strong advection of warm air within the cloud head and strong cold advection behind, as we can follow in the loop of images in Fig 5.3.
In the loop of Meteosat 9 Airmass RGB (Fig 5.7) the reddish area indicates dry descending stratospheric air. This is another sign of the ongoing cyclogenesis and supports further development of the system.

Figure 5.7: Meteosat 9 Airmass RGB overlayed with geopotential height 500 hPa, from 18 Dec 12 UTC to 20 Dec 06 UTC
There was also a pronounced PVA maximum in both 300 and 500 hPa connected to the jet indicating further development of the depression (Fig. 5.6). At 06 UTC the flow started to turn to a southwesterly direction, bringing moist air over a cold surface. At this point snowfall was recorded along the northern and central Adriatic coast as well as inland. By noon the low moved to the south Adriatic with snow spreading also to the eastern parts of the Croatian inland. In the upper levels a deep low persisted over north Italy and central Europe. Strong gradient in geopotential height field at 500 hPa indicated a very strong southwesterly flow. Cold air was moving across the Adriatic and warm advection within the cloud-head was still very strong.
By the end of the day cold air covered the whole country with snow still falling over the most parts of the inland.
Snowfall and cold on 19th December
As we mentioned earlier, the precipitation was recorded over Croatia in the previous days but it was the most intensive on the 19th December. The reason for that was cold air from the North which penetrated into the western Mediterranean and in the strong westerly flow came to the Genoa Bay. (Fig 5.7) There, the cyclone was developed, picking up warm and humid air and with cold air from the north produced heavy snowfall over Croatia. The process was very intensive, the atmosphere was unstable and the thunderstorms were observed.
The first snow started to fall at midnight on 19th December in the southern part of the Istria peninsula and intensified during the next 10 hours. (Fig 5.8) The snow spread quickly over the north Adriatic, along the coast and also on islands. The snow at the seaside is not very common, especially the amount which was measured in the morning on 19th December. Namely, in several hours (from 01 till 07 local time) between 5 and 15 cm of snow fell.
Figure 5.8: Surface observations during 19 Dec 2009
The calm weather inland with the snow cover from previous days and a pool of cold air in the upper levels, caused very low temperatures (up to -18 °C) in the morning of 19th December, especially in the eastern part of Croatia. (Fig. 5.9)
Figure 5.9: Minimum temperature (during the night 18/19 Dec) and the amount of precipitation (in last 12 hours) for 19 Dec
From the early morning till noon on the 19th, in a strong south-westerly upper level flow, the moist air was pushing toward North-East. The snow spread all over the inland and also along the coast of the North and Middle Adriatic. The precipitation was very intense and in many cases in form of showers, due to strong convective development occurring especially along the coast and in the Dalmatian inland (where orography played a role) (Fig 5.10).
Figure 5.10: Lightning data on 19 Dec between 03 and 10 UTC (magenta cross-lightning observed in last 3 minutes, red cross - lighting observed before 3 to10 minutes, orange - before 10 to 20 min, yellow - before 20 to 30 min, green - before 30 to 40 min, cyan - before 40 to 50 min, blue cross - lighting observed before 50 minutes or more)
At the same time along the coast of the North Adriatic a strong bora wind with stormy gusts (up to 50 knots) was blowing. The bora spread along the Adriatic coast till the beginning of 20th December. It was also windy over the land, the north-east wind intensified during the morning of the 19th December.
In the afternoon the snowfall started to weaken and stopped along the coast, but continued in the inland till the end of the day. The result of cyclonic activity and cold advection, as related to precipitation, was a new snow cover in the inland, roughly between 5 and 35 cm. At the end of the day the snow cover was measured also along the coast of North and Middle Adriatic and on the islands of the North Adriatic (height between 1 and 16 cm). At the same time the amount of rain at some stations at the south part of the Adriatic was up to 50 mm. (Fig 5.11)
Figure 5.11: Maximum temperature and the amount of percipitation (in last 12 hours) for 19 Dec
The morning after - Extreme Cold!
The skies cleared in the night and the combination of clear skies, snow on the ground and strong cold advection caused extremely low temperature in the morning of 20th December. (Fig 5.12)
Figure 5.12: Minimum temperature (during the night 19/20 Dec) and the amount of precipitation (in last 12 hours) for 20 Dec
The temperature was even lower than the morning before. In the inland the minimum temperature was between -20 and -10 °C. On some weather stations on the Istrian peninsula (Pazin -16 °C, Pula -9 °C) minimum temperature was an apsolute minimum measured in the last 60 years.
The presence of very cold air in the upper levels can be followed in the loop of Airmass RGB satellite images overlaid with temperature at 500 hPa (Fig 5.13). The pool of cold air associated to the upper level low moved together with the low (and trough) further to the east. Red color in the satellite images indicates cold and dry stratospheric air. The temperature at 500 hPa was between -36 and -32 °C.

Figure 5.13: Meteosat 9 Airmass RGB overlayed with temperature at 500 hPa, from 19 Dec 12 UTC to 20 Dec 06 UTC
The RGB combination of Meteosat 9 (0.6, 1.6 and 3.9 μm) image provides a nice view to the snow on the ground after the skies cleared over Croatia and neighbouring countries (magenta colour) (Fig 5.14).
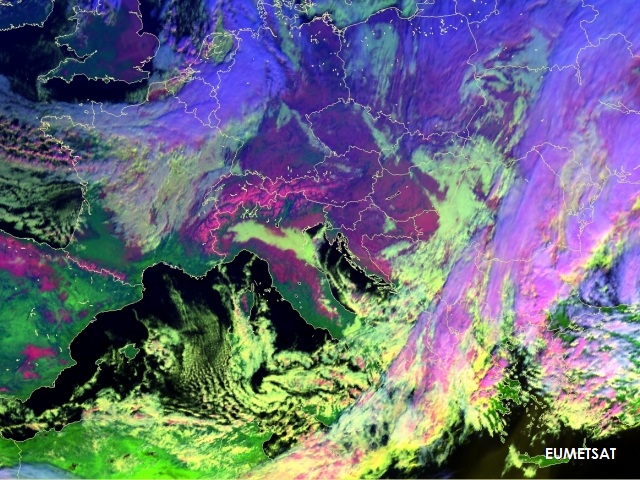
Figure 5.13: Meteosat 9 RGB: 0.6, 1.6 and 3.9 μm - 20 December 2009 1000 UTC