Snow in the Netherlands
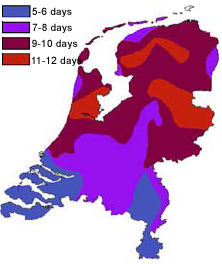
Figure 3.1: Number of days with snow cover for the entire month December 2009. Source KNMI.
It was already mentioned in the introduction that the winter in the Netherlands was only exceptional due to the number of days with snow-cover (Fig. 3.1). This snow started during the second half of December when in a few stages several centimeters of snow fall disrupting public life and causing chaos on the streets and the railways.
In the following four subchapter the Meteosat 9 satellite images will be presented and overlayed with a variety of basic ECMWF numerical fields. This combination will help us to understand the genesis of the cold air outbreak and also makes it able to identify from which winddirection air is flowing to explain the presence of snow.
High pressure: it's getting colder
The Cold Air Outbreak explaing the cold temperatures and snow starts the 10th December with the building of a strong high pressure ridge. The surface high is found at the end of the animation (Fig. 3.2) over the British Isles and Scandinavia.

Figure 3.2: ECMWF Geopotential Height 1000 hPa. (magenta) and 500 hPa. timeseries. Use the arrows in the animation to navigate.
This high pressure ridge strengthens the following days before it transforms into a blocking high pressure system near Iceland/Greenland (Fig. 3.2). With another high pressure system situated over Russia a classic constellation for a cold winter (that can persist for a long time) has been set. With the buildup of the high pressure system over the UK, the governing flow over the Netherlands changes when the wind turns from North-West on the 10th, to North-East on the 11th, causing the air to dry (Fig. 3.3).

Figure 3.3: ECMWF Wind 850 hPa. 10 December 2009 12UTC (left) and 11 December 2009 12UTC (right).
From the 12th onwards the sun started to play more a role. On the 11th the temperature still had positive values between 7 and 10 °C, from then onwards the temperatures decreased each day by a few °C (Fig. 3.4).

Figure 3.4: Meteosat 9 HRV RGB with overlay surface observations. Timeseries. Use the arrows in the animation to navigate.
The high pressure system moves NW on the 14th, but still some influence over Germany is found with a ridge axis situated over Netherlands producing calm and clear weather. This situation remained unchanged on the 15th. Clear skies during the night with temperatures down to -9 °C. On the 16th the high pressure ridge moves south and its influence on the weather decreases. From the NW the cloudiness increases as an omen to (lots of) precipitation (Fig. 3.5).

Figure 3.5: Meteosat 9 Airmass RGB with overlay surface observations and mean sea level pressure. timeseries. Use the arrows in the animation to navigate.
Snow on 16th and 17th
Because the blocking high pressure retreated towards Iceland the governing upper level flow changed to northerly. Within this upper level flow a complex structured cyclone moved south over Skandinavia. On the 16th/17th the western part of this depression moved over the northern islands of the Netherlands and its westcoast. The preciptation reached the northcoast on the afternoon of the 16th. Influenced by the depression the wind had changed to (south)west. Along the coast the temperature rose to +2 to +5 °C and all precipitation was in the form of rain. More inland the temperatures were still around freezing and especially during the night snowfall was reported in the northern part of the Netherlands (10 to 30 centimeters) as the cyclone was moving slowly south.
In the below animation the Meteosat 9 Airmass RGB is shown with overlay of the geoptential height at 1000 and 500 hPa. Also the surface observations are plotted. Note the more reddish colour of the satellite image near the depression. This indicates the dry upper air (e.g. the cyclogenesis in which dry stratopsheric air is protruding downward). Underneath this reddish colour there is on the depression the indication found of low cloudiness. The classic ingredients of moisture below and dry aloft, in combination with the warmer temperatures of the North Sea and the colder upper level temperatures must have had a destabilising effect explaining the snowshowers experienced and also seen in the vicinity of the depression.

Figure 3.6: Meteosat 9 Airmass RGB with overlay surface observations and geopotential height 1000 (magenta) and 500 hPa. Timeseries. Use the arrows in the animation to navigate, rightclicking the animation will allow you to zoom in.
With the wind being calm near the rotating center and the temperatures just below zero, the ratio between mm. of rain and snow was 1/15, to 1/18, whereas normally for such conditions a ratio of 1/10 is taken into consideration (Huiskamp, 2010). In the western part of the Netherlands and towards the center between 3 to 5 centimeters (Fig. 3.7) of snow caused a strong impact on the early morning traffic with a total of 671 kilometers of traffic-jam. During the 17th some more centimeters of snow were added because of an active area with precipitation found in North-South direction over the Netherlands on the eastern flank of the cyclone.
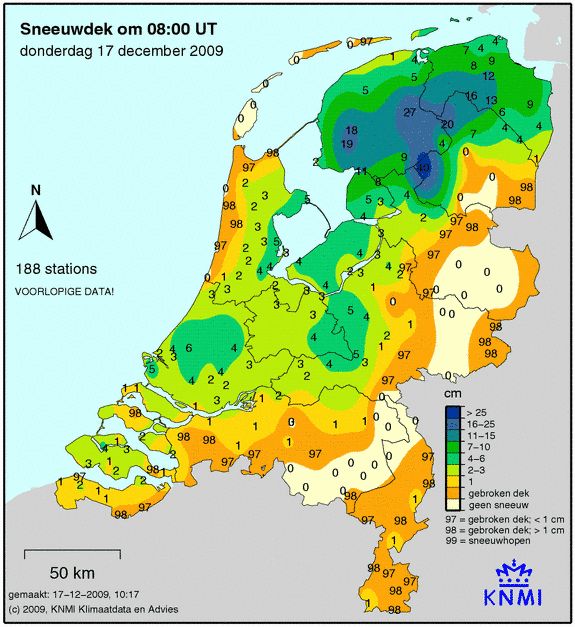
Figure 3.7: Snowcover over the Netherlands on 17 December at 08UTC. Especially the northern part received snow up to 30 cm. Source KNMI.
Later on the 17th the depression moves SW and the precipitation becomes less. After the passage of the front the influence of the high pressure belt between Greenland and Russia recovers and the flow changes back to North-East. This meant that the temperatures in the following hours decreased and by the 18th no positive temperatures were longer recorded (Fig. 3.6).
Upper Level Low: Real cold!
Meanwhile an upper level low was situated over Germany, which would play a major role for the snow to come on the 20th. During the evening of the 18th on the northern flank of this low very cold and dry air spread over the Netherlands. With an approaching ridge of high pressure from the north the wind became less and extreme cold temperatures were recorded during the night from 18 to 19 December.

Figure 3.8: Meteosat 9 Airmass RGB with overlay surface observations and geopotential height 500 (green). Timeseries with indication of Upper Level Low (ULL). Use the arrows in the animation to navigate, rightclicking the animation will allow you to zoom in.
The 19th was a cold day with temperatures between -5 and -10 °C. After the passage of the ridge the wind had changed to south. The associated weather was calm and clear and lower temperatures of up to -18 °C were recorded inland. Also at 850 hPa the temperature was below -10 °C.
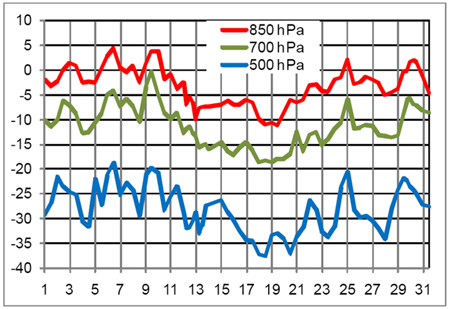
Figure 3.9: Upper level temperature of the month December 2009 in de Bilt, Netherlands. Displayed are the 12UTC temperatures at 850, 700 and 500 hPa., resp.
On the 20th: Snow!
Along the Norwegian coast an active depression had developed, which on the flank of the blocking high moved rapidly towards Scotland. In the below animation the Meteosat 9 Airmass RGB is shown in combination with the geopotential height at 1000 and 500 hPa. This active depression is denoted by 'L1' in the below animation. To explain the snow in the Netherlands a second trough however plays a more prominent role which can be recognised in the NWP fields at 19th December at 1800UTC just south of Norway (indicated as 'further deepening trough').

Figure 3.10: Meteosat 9 Airmass RGB with overlay surface observations and geopotential height 1000 (magenta) and 500 hPa. Timeseries. Use the arrows in the animation to navigate, rightclicking the animation will allow you to zoom in.
In the following timesteps the trough maintains a more southern course towards the Netherlands. A trough likes this normally means warmer temperatures (because it moves over 'warmer' sea) on the western flank and certainly no snow. However, very important to now take into account is the role of the upper level low of the previous day. This ULL had cooled the air significantly even as far as England and also in the lower layers (-10 °C at 850 hPa!) it was freezing cold!
At 06UTC the depression (noted in the above animation as 'L2') is found over the North Sea. An occluded band associated with snowfall accompanies it and is situated over the Netherlands. At this timestep the depression, L2, gets an impulse from the mother-low L1 and moves rapidly east in the following hours. By 12UTC it is found over western part of Germany and another 6 hours later, at 18UTC, it is found near the border with Poland. The associated snowfall sums up a few centimeters, more important is however the wind which had caused snowdrift.
At 12UTC of the 19th the surface field shows us a second trough which is accompanied by showers as revealed by the corresponding Airmass image. With the passage of this trough, especially in the western and central part of the Netherlands most snowfall was recorded (10-15 cm). Also reports of thunderstorms are associated, partially due to the fact of the extreme cold upper level temperature (-38 °C at 500 hPa.) over the North Sea (Fig. 3.11).
On the 21st December at 06UTC still some (snow)showers can be found over the North Sea, trailing in the cold air behind the depression L2. Over the Netherlands the wind had changed to South-West. From south more cloudiness would move in and during the evening hours a warm front passes the Netherlands. With still freezing temperatures the warm front would bring (especially north) another few centimeters of snow. In the southern regions of the Netherlands the temperatures had slowly rised and on the 22nd December all the temperatures were positive and the snow was melting.
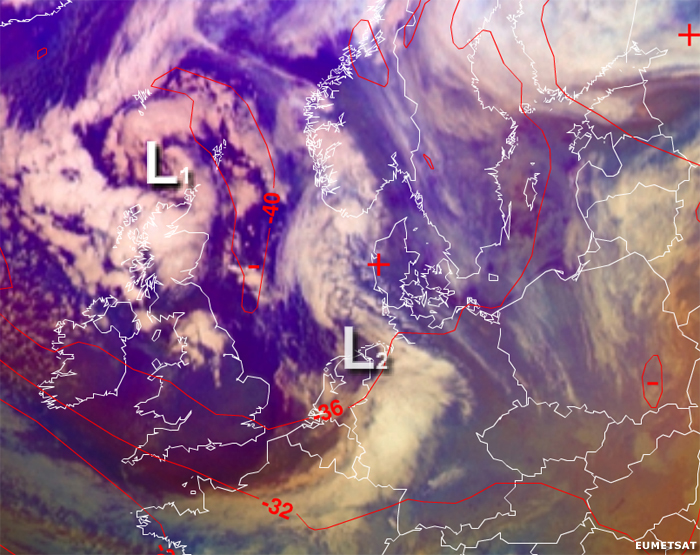
Figure 3.11: Meteosat 9 Airmass RGB 20 December 1200UTC - ECMWF Temperature at 500 hPa.