Snow in England
The previous chapter we could already read the impact the snowfall had on public life in the Netherlands. During the same time also snow in eastern England disrupted life and caused chaos on the motorways. The origin/explanation to this snow is however different to that of the Netherlands, hence the reason to devote an extra chapter to it.
The relatively warm North Sea and the colder air above it would provide the ingredients for Lake-Effect Snow. A mesoscale process that can be well monitored and diagnosed using model fields and satellite imagery. Before we show these, we will first start to explain which key-features need to be in place for Lake-Effect Snow to occur.
Lake-Effect Snow
The Lake-Effect Snow finds its naming over the populated areas of the Great Lakes in the United States where it can produce during winter time up to 5 meters of snow. The effect is however not restricted to this area and is found in other parts of the world including, as you will see in this case study, the North Sea.
Lake-Effect Snow happens when polar air moves over relatively warm sea water. The warmer water provides energy for water vapour to be picked up which freezes and is deposited on the coastal regions as precipitation. Depending on the temperature difference between the sea water and the air aloft (and subsequently the energy available) the uplifting can create heavy showers that organise as long lines (cloudstreets) while moving over water. As soon as the showers hit the coastal regions, the topography plays as a trigger causing snowfall. Due to the showery character this snowfall may differ in intensity.
Several factors help to explain the formation of lake-effect snow:
Instability
For the vertical transport of moisture and heat an aboslute instability is required. As a measure for this instability in the boundary layer the temperature difference between sea surface and 850 hPa is used. The temperature difference needs to exceed 13 °C. Affected indirectly by this is the inversion. If it is found below 1000 meters, the boundary layer is considered to be to shallow for the development of convective showers. If the inversion is below 2500 meters usually (heavy) snowfall may be taken into account (Floor, 2010).
Fetch
Another factor playing a role in the formation of the cloud streets is the wind. Sufficient wind must be available allowing the polar air to flow over sea and affecting enough moisture in the direction of the coastal regions. More wind means a better exchange of moisture between the "warm" seawater and the cold air above. Too much wind however is not ideal as it would mean less exchange of moisture. The winddirection at 850 hPa. helps to determine the areas which are likely to be affected by snow. The direction also helps to determine the fetch. The fetch is the distance the showers move over relatively warm water; the longer the fetch the more active the convection will also will be. For serious convection the fetch needs to be at least 80 km (Floor, 2010).
Wind Shear
Directional shear is one of the most important factors governing the development of the cloud streets; environments with weak directional shear typically produce more intense convection than those with higher shear levels. If directional shear between the surface and 700 hPa level is greater than 60 °C, hardly and convection and showers will be experienced. If the directional shear between the surface and 700 hPa level is between 30 and 60 °C, weak lake-effect bands are possible. In environments where the shear is less than 30 °C strong, well organized bands can be expected.
Moisture
If upstream moisture has a higher relative humidity it will allow more condensation and a more quicker and quantitative formation of clouds and precipitation.
Synoptic forcing
From a synoptic point of view a maximum of vorticity advection aloft and a large scale upward motion may help to increase mixing and the convective depth for convection to develop, while a cold air advection maximum may increase the temperature difference and the absolute instability.
Snow and Ice cover
A negative effect on the formation of Lake-Effect snow is experienced later in winter when the lakes and sea freeze over. Especially on the Great Lakes in the Unites States but also in the nordic countries of Europe (Gulf of Bothnia, Gulf of Finland, Baltic Sea) ice coverage means a significant decrease of fetch but also due to the decreased temperature difference between the surface and the upper layers there is no instability and upward motion of moisture available any longer. Such a situation however does not (yet) affect the warm waters of North Sea.
MODIS Satellite Imagery
The Lake-Effect that was discussed in the previous subchapter helps to understand the severe snowfall in the UK. Below we see a MODIS Aqua image of 17 December showing this phenomena.
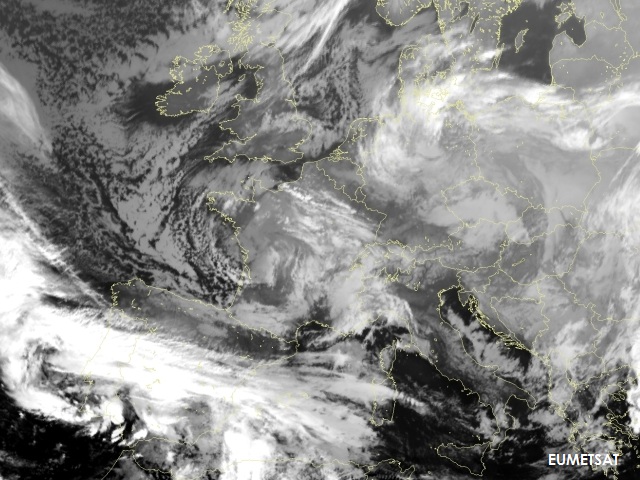
Figure 4.1: MODIS AQUA Bands 1, 4 and 3 - 17 December 2009 1137UTC. Source NASA/GSFC, MODIS Rapid Repsonse
The resolution of 500 meters that MODIS gives, provides an interesting view on the conceptual model of interest. Over Vänern (largest lake of Sweden) the so-called Lake-Effect finds it origin as a cloudstreet emerges when a cold southwesterly moves over the relatively warm water. The cloudstreet find its continuation over the Kattegat and the North Sea. The fetch over Lake Vänern was more than 80 kilometers to forfill one of the conditions for Lake-Effect snow to form. Further south over the North Sea the characteristic cloudpattern is found on the westcoast of Denmark (Jutland). The showers are due to smaller fetch (still) less pronounced. The showers however enhance further downstream.
Below we find another two RGB images from MODIS TERRA using the bands 7, 2 and 1 for the 17th (left) and 18th December. The resulting image is similar to the "Natural Colour RGB" we well know from the Meteosat Second Generation Satellites. Channel 7 lies at a wavelength of 2.155 μm, channel 2 at 0.876 μm and channel 1 at 0.670 μm, resp. Channel 7 hereby provides the microphysical content as it has a higher absorption of ice particles (and snow) in oppose to water particles. This makes it that waterclouds appear bright and whitish in the resulting RGB. Snow and iceclouds appear cyan. As a result of higher reflectivity in the 2.155 μm wavelenght, vegetation appears green.
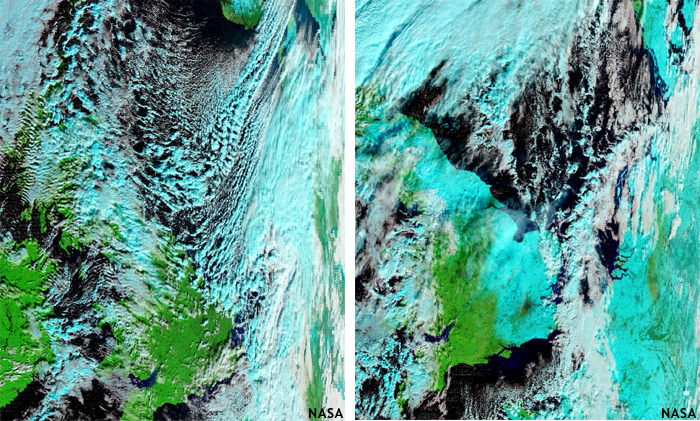
Figure 4.2: MODIS TERRA Bands 7, 2 and 1 - 17 December 2009 1137UTC (left, no snow over England) and 18 December 2009 1046UTC (right, snow covered England). Source NASA/GSFC, MODIS Rapid Repsonse.
Due to the Lake-Effect it can be concluded that much snow has fallen over South-East England in the following 24 hours (compare the left image to the right image!). Interesting to notice is also the city London that can be well observed in the right image. This Metropole acts as a warm pool and the absence of snow provides a high contrast to its surroundings. Also the Netherlands, Belgium and Skandinavia are widely covered by snow. The cause of this snow is however different as you could read before.
MSG Satellite Imagery and Lake-Effect Criteria
The previous subchapter showed the Lake-Effect Snow using the MODIS satellite. This is a polar orbiting satellite, which does provide a high contrast and high resolution images, however a close monitoring of the effect would ask for a higher temporal resolution. With help of geostationary satellite and 15 minute interval the Lake-Effect is monitored with Meteosat 9 satellite.
Figure 4.3: Metosat 9 Natural Colour RGB - 17 December 0900UTC to 1300UTC.
In the above animation the Natural Colour RGB is shown which uses the channels 1.6 μm, 0.8 μm and 0.6 μm on red, green and blue, resp. The resulting images can be compared with the MODIS images that was shown in the previous subchapter. Again snow and iceclouds appear in cyan. The cloudsteets emerge from Lake Vänern in Sweden. Over the Kattegat they are still whitish, indicating waterclouds and no icing at that stage. Further downstream, over the North Sea, the instability increases due to the higher contrast between sea surface temperature and upper level temperature and as a result more icing of clouds and also some small scale cumuli are observed. The longer the fetch, the more enhanced these cumuli tend to get and especially over Eastern England at the end of the animation some larger cumuli are observed resulting in heavy snowshowers.
Satellite provides a good analysis if Lake-Effect Snow has occured, the conditions (which were described in the previous subchapter) however need to be analysed using a set of numerical fields. Below we see the Skew-T diagram of the station Ekofisk, located in the center of the North Sea at 56.52 °N/3.21 °E of 17 December 2009 at 12UTC.

Figure 4.4: Skew-T diagram of Ekofisk; 17 December 1200UTC. Right-clicking will allow you to zoom and pan this diagram.
Source University of Wyoming
The information seen in this diagram may also be accessed over this list. The temperature of the sea surface during this event can be derived from the SST product made available by by the OSI-SAF and is seen in the following animation. With the availabiliy of these two information sources now answer following question.