Synoptic Situation: Satellite Images, weather and basic numerical parameters
During the evening of 8th June 2004 a super cell developed over the western part of the North Sea. Until 02 and 03 UTC it crossed the North Sea and achieved its maximum intensity. Over North Germany the super cell splitted. The right part intensified again whereas the left one dissolved. Around 07 UTC the right part exhibited the highest intensity. Intense preciptiation (up to 20 mm) and gusts (up to Beaufort 10) were observed.
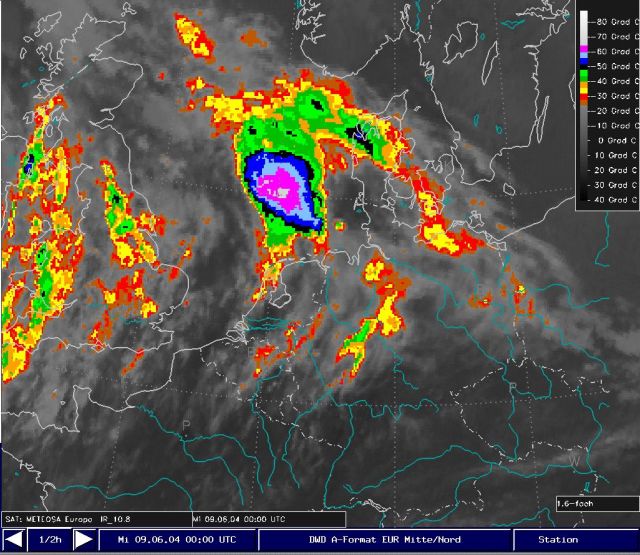
9 June 2004/00.00 UTC - Enhanced MSG IR10.8 image
|
From 00 UTC to 02:30 UTC the super cell moved over the Eastern part of the North Sea. A big area (about 20,000 km˛) showed a cloud top temperature of less than –60°C, in its centre less than -65°C. At about 6:30 UTC the super cell splited and in accordance of the rule „severe right moving“ the right part (looking into to the direction of streaming) intensified. Till noon the whole system weakened. |
IR-imagery significant weather: time sequence
In this chapter the observed weather in combination with the wind and IR-image (cloud below -65°C, temperature of tropopause) is presented.
IR-imagery surface pressure and wind: time sequence
With this combination we will investigate the fine structure of surface pressure and wind systems near a super cell.
IR-imagery, pseudopotential temperature and wind at surface: time sequence
In this chapter the pseudopotential temperature in combination with the 10m-wind barbs are considered in order to follow on the movement and development of the surface convergence and the type of air mass and to put both in relation to the satellite images.
IR-imagery, tendency gusts (1h): time sequence
In this chapter we combine gusts and relevant patterns of the IR-image.
Relevant radiosoundings of 00 UTC
In that chapter we investigate radiosoundings of locations near the passage of the super cell.
IR-imagery, surface pressure and temperature 850 hPa: time sequence
For the analysis of fronts we combine surface pressure and the temperature in 850 hPa. Both is combined with the corresponding IR-image.
IR-imagery, surface pressure and geopotential 300 hPa: time sequence
In this chapter we follow the development of the clouds in correspondence to the fields of surface pressure and geopotential in 300 hPa. During summer we find more details about the structure if we use the geopotential in 300 instead of 500 hPa.
IR-imagery, wind 300 hPa: time sequence
In this chapter we consider the wind speed near the jet niveau and put it in relation to corresponding satellite images.
IR10.8 and WV 7.3 imagery: time sequence
By comparision of IR and WV we are able to detect areas of overshooting (IR < WV). Due to techniqual reasons the DWD is not yet able to perform differences between two channels. Therefore, we have to compare two pictures by marking interesting temperature ranges (cloud top temperatures below tropopause’s temperature).
IR10.8 imagery, time sequence of extremely stretched temperature ranges
By processing the images in that way we are able to recognise and to follow the development of V-Notches.
Several MSG RGB combinations: different presentation of a V-notch
Several different MSG RGB's are shown and explained and help to recognise and to follow the development of V-Notches.
Summary of the investigations in this chapter
The case from 09 June 2004 is an example of an unusual development of a super cell:
- A warm front wave developed within the frontal zone extending from the North Sea to Eastern Europe. At its warm site a super-cell established that was triggered by a short wave trough moving fast from the North Sea to the Chech Republic.
- Radiosoundings along the passage of the super cell showed a strong vertical wind shear, potential instability (pseudopotential temperature) between 1 and about 5 kilometres height and a tropopause at about 12 kilometres (about -64°C).
- The surface pressure exhibited the typical dipole structure of a meso-cyclone near and east of the super cell centre and a well pronounced meso-height at its rear. High pressure tendencies were reported (up -5.6 hPa/3h, +3 hPa/3h).
- Precipitation amounts of up to 20 mm and gusts up to Beaufort 10 were measured.
- The satellite imgages reveal clearly the fast development of new overshootings, mainly at the warm site of the cloud complex. At about 6 UTC we observe the splitting of the super cell with a succeeding decaying of the northeastern part and an intensifying at the southwestern site.
- At 01 UTC the a V-Notch started to develope and achieves the most pronounced shape between 02 and 02:30 UTC. After the splitting around 06 UTC a second V-Notch developed at the warmer site of the convective complex that lasted from 06:30 to 07:30 UTC. Cloud top temperatures of -69.5°C were detected.