
Atmospheric Composition
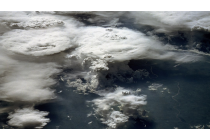
Deduce cloud top heights based on brightness temperatures, surface observations and sounding data.
In this part of the course you will not only learn more about the identification of clouds such as Stratus, Cumulus and Cirrus from satellite images, and you will also discover various methods to derive cloud height information. Microphysical properties of clouds like cloud phase and cloud particle size are also addressed.
To access the resource click here.
Note: all resources are provided as an external link which redirects you to https://eumetcal.eu where you will need to create a user account in order to gain access to the course
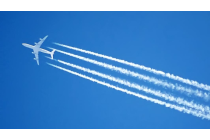
Identify contrails and ship trails.
In this part of the course you will not only learn more about the identification of clouds such as Stratus, Cumulus and Cirrus from satellite images, and you will also discover various methods to derive cloud height information. Microphysical properties of clouds like cloud phase and cloud particle size are also addressed.
To access the resource click here.
Note: all resources are provided as an external link which redirects you to https://eumetcal.eu where you will need to create a user account in order to gain access to the course

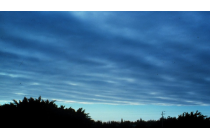
Identify fogs and discriminate between fog and low cloud.
In this part of the course you will not only learn more about the identification of clouds such as Stratus, Cumulus and Cirrus from satellite images, and you will also discover various methods to derive cloud height information. Microphysical properties of clouds like cloud phase and cloud particle size are also addressed.
To access the resource click here.
Note: all resources are provided as an external link which redirects you to https://eumetcal.eu where you will need to create a user account in order to gain access to the course
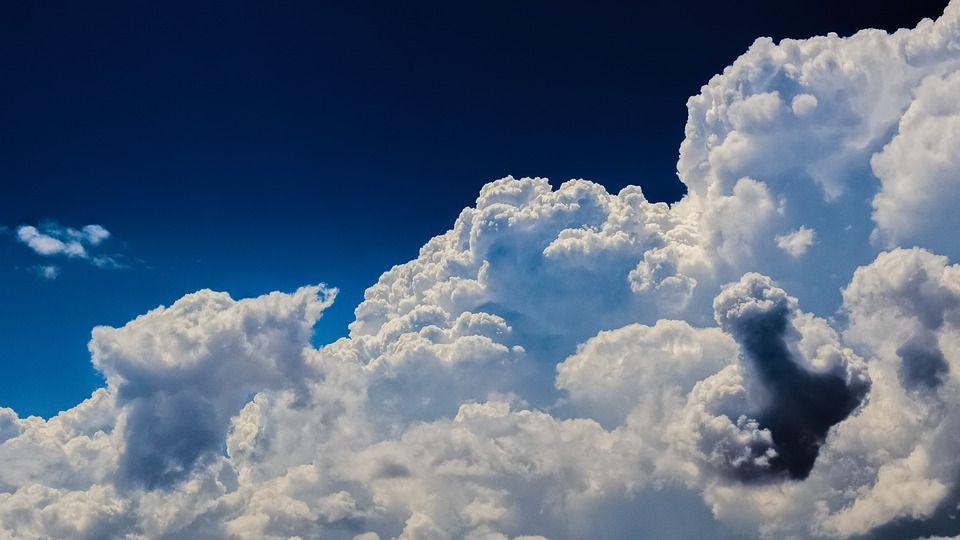
Identify cumulonimbus clouds and their characteristics.
In this part of the course you will not only learn more about the identification of clouds such as Stratus, Cumulus and Cirrus from satellite images, and you will also discover various methods to derive cloud height information. Microphysical properties of clouds like cloud phase and cloud particle size are also addressed.
To access the resource click here.
Note: all resources are provided as an external link which redirects you to https://eumetcal.eu where you will need to create a user account in order to gain access to the course
Identify stratiform, cumuliform and cirriform cloud regions and individual cloud forms and their characteristics.
In this part of the course you will not only learn more about the identification of clouds such as Stratus, Cumulus and Cirrus from satellite images, and you will also discover various methods to derive cloud height information. Microphysical properties of clouds like cloud phase and cloud particle size are also addressed.
To access the resource click here.
Note: all resources are provided as an external link which redirects you to https://eumetcal.eu where you will need to create a user account in order to gain access to the course
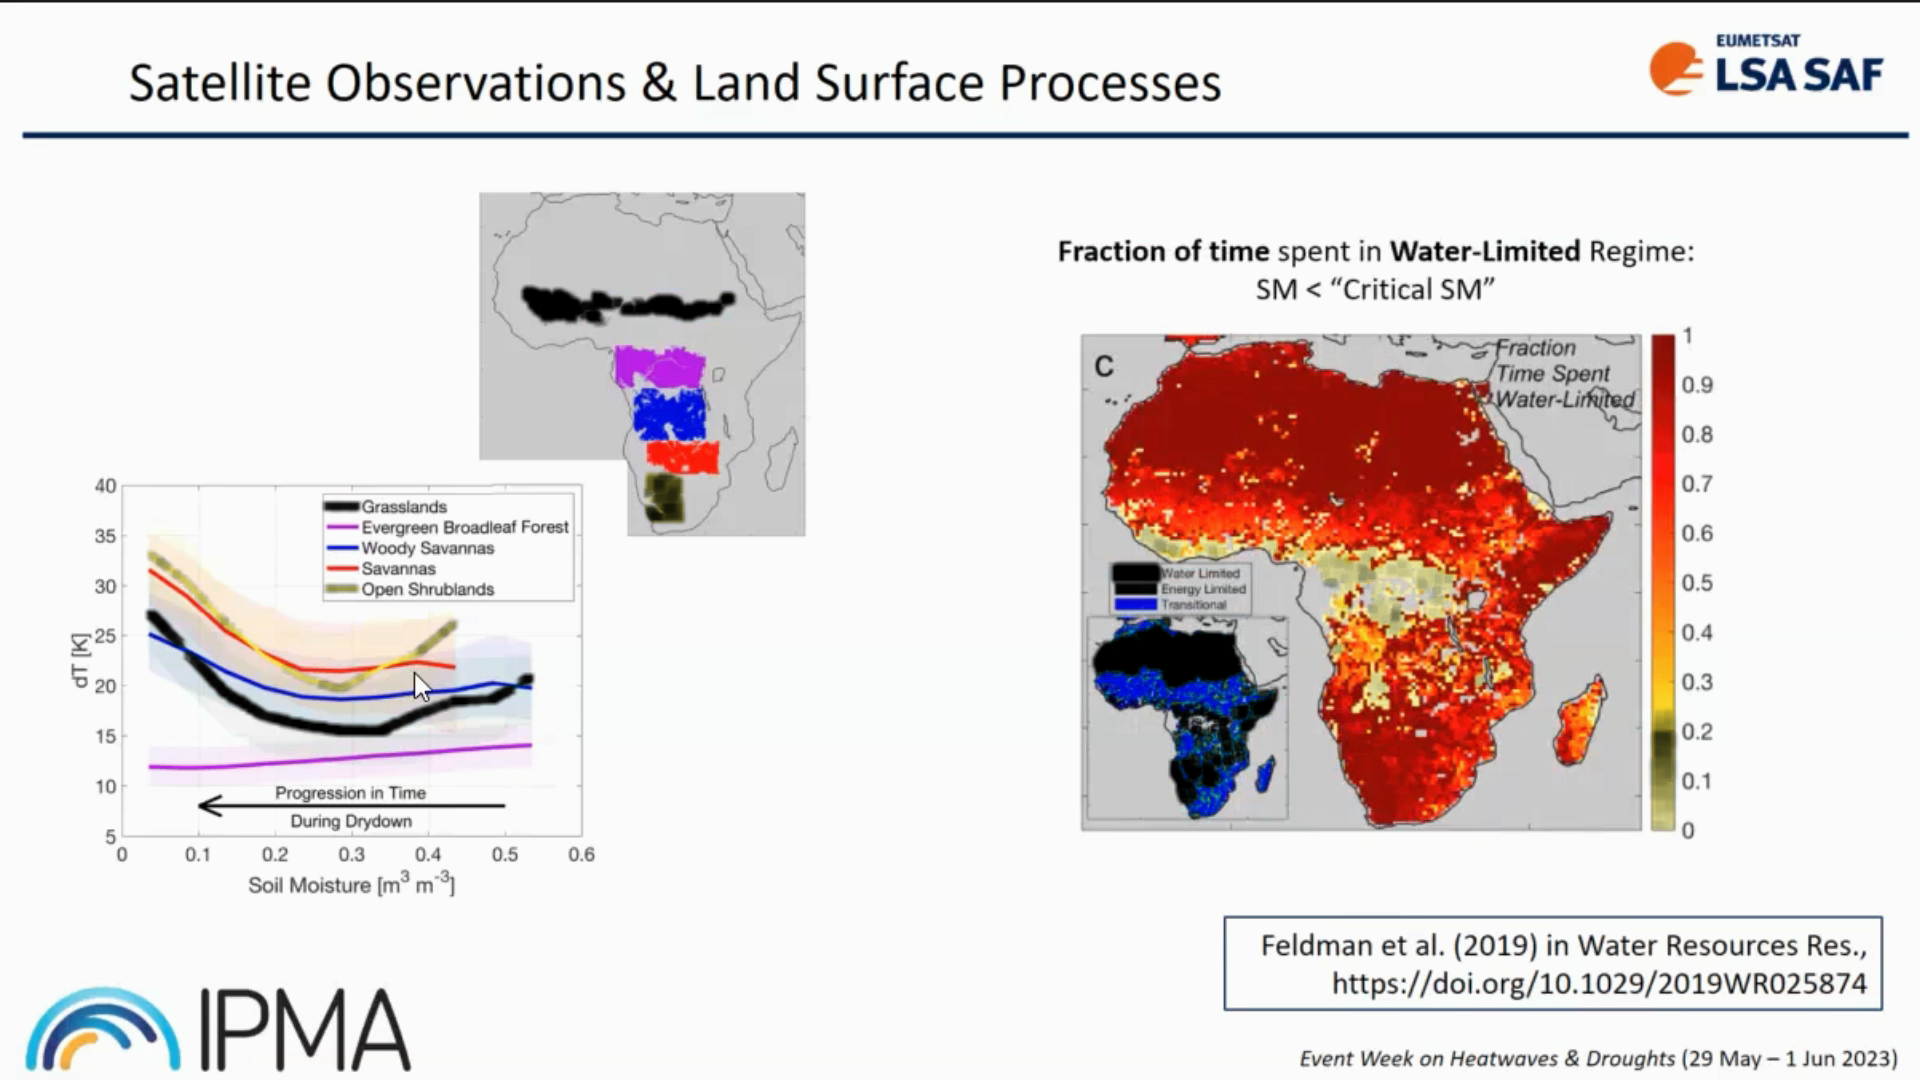
Isabel Trigo provides insight into LSA SAF datasets and its usage.
Heat and water stress leave clear signatures on land surface variables that can be monitored from space. The LSA SAF has been providing satellite datasets and products that allow the characterization of the surface energy budget and the monitoring of vegetation growth and stress. We will show that the combination of information on the surface temperature diurnal cycle and on vegetation state provides a different perspective on the spatial extent and time evolution of droughts and heatwaves, and reveals underlying soil vegetation-atmosphere feedbacks.
Anu-Maija Sundström gives an overview presentation on AC SAF products and on long-range transport events.
AC SAF provides various satellite observations on atmospheric composition, that are relevant for assessing air quality and climate. In this talk an overview of the AC SAF products is given by introducing practical examples of recent major air quality episodes. The focus will be on long range transport events that are highly affected by prevailing wind conditions.
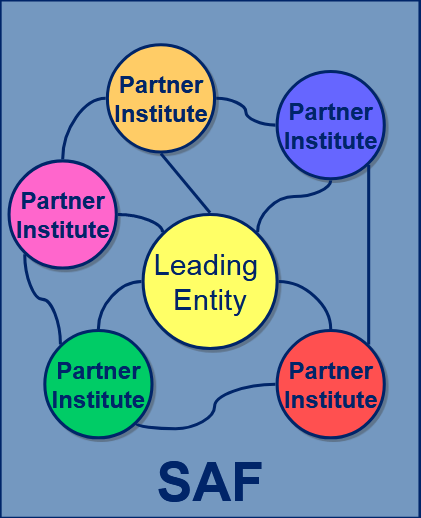
Lothar Schueller gives an overview on the SAF structure and the generated products.
Length: 30 minutes.
SAFs are dedicated centres of excellence for processing satellite data, achieved by utilising specialist expertise from the Member States. SAFs generate and disseminate operational EUMETSAT products and services and are an integral part of the distributed EUMETSAT Application Ground Segment.
Each SAF is led by the National Meteorological Service (NMS) of a EUMETSAT Member State, in association with a consortium of EUMETSAT Member States and Cooperating States, government bodies and research institutes. The lead NMS is responsible for the management of each complete SAF project. The research, data and services provided by the SAFs complement the standard meteorological products delivered by EUMETSAT’s central facilities in Darmstadt, Germany.
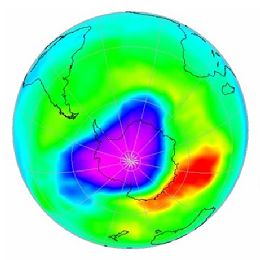
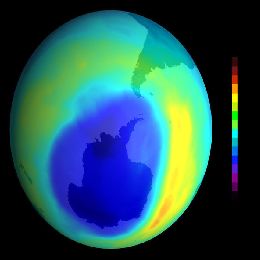
Nan Hao from DLR gives an overview on ozone and other trace gases products from the O3M SAF. The presentation is completed by numerous examples.
This lecture focuses on the ozone and other minor trace gas products, such as NO2 and SO2, from the GOME-2 and IASI instruments on MetOp. These products are developed in the framework of EUMETSAT’s Satellite Application Facility on Ozone and Atmospheric Chemistry Monitoring (O3M-SAF), as part of EUMETSAT’s Polar System (EPS) Ground Segment. The O3M-SAF is responsible for the algorithm development, the operational processing, dissemination and archiving of the products, as well as providing User Services. The ozone and minor trace gas products from GOME-2 and IASI are used in research of atmospheric composition, like ozone loss, dynamics, anthropogenic effects, and in applications of environmental security, like monitoring of volcanic eruptions and pollution.
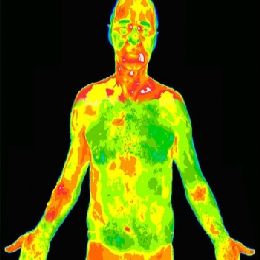
The scope for this 30 minutes lecture is to define origins of IR radiation and how it is measured by meteorological satellites.
Overview and application of infrared channels presented by Jan Kanak. The scope of this 30 minutes lecture is to define origins of IR radiation and how it is measured by meteorological satellites. Thermal radiation wavelengths are spread in wide interval from basically 1 µm up to 1000 µm, but in this case interest is only in middle IR (3 - 8 µm) and long IR (8 - 15 µm) spectrum.
Physical background and meteorological interpretation of satellite images is similar to all meteorological satellites, but in this lecture emphasis will be on those derived from SEVIRI instrument, on board MSG satellite. Some of the practical aspects of utilization of MSG SEVIRI data, examples and useful remarks on IR images visualization you can see here. IR imagery is historically very basic observation method of atmosphere and clouds, together with visible imagery.
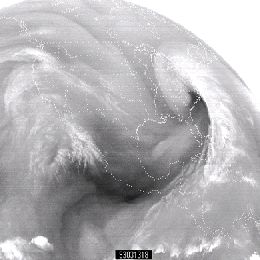
For knowing which processes are present in the atmosphere good interpretation of WV satellite images is needed. For gathering information about water vapor, SEVIRI instrument on board MSG satellite is scanning atmosphere in two channels in water vapor absorption band; 6.2 and 7.3 µm.
WV images are like a footprint of absorption of radiation by a water vapor, which is the main absorber in the atmosphere. Therefore it is clear that understanding of these images can tell us a lot about footprint of atmosphere itself and about processes in it. For knowing which processes are present in the atmosphere good interpretation of WV satellite images is needed.
For gathering information about water vapor, SEVIRI instrument on board MSG satellite is scanning atmosphere in two channels in water vapor absorption band; 6.2 and 7.3 µm. Among these two WV channels, the radiation in channel 6.2 µm is more easily absorbed by water vapor and has a larger information content. Thus is called primary WV channel and is broadly used in image format for weather analysis and forecasting based on synoptic scale interpretation. 7.3 µm channel can also be used in operational forecasting environment for detecting mid-level moisture features associated with low-level thermodynamic conditions. Presenter for this one hour lesson is Christo Georgiev, from Bulgarian National Institute of Meteorology and Hydrology.
This lecture on absorption channels and IASI instrument on board MetOp satellite was held by Xavier Calbet from EUMETSAT.
This lecture on absorption channels and IASI instrument on board MetOp satellite was held by Xavier Calbet from EUMETSAT. MetOp is LEO polar orbiting satellite that is spinning around Earth at a height of approximately 800 km. IASI instrument is scanning atmosphere below him in mostly infra-red spectrum band, therefore it can detect emission/absorption of gases like CO2 and O3 quite good, due to their intrinsic physical properties. In that way you one can track these gases in the atmosphere and mark their spatial and temporal distribution.
Lecture starts with comprehensive physical background of radiation, with topic like absorption/emission of the atmosphere, properties of the black bodies (Sun and Earth) and EM waves, etc. which are crucial for understanding of instrument functioning. After that there is explanation of spectral band of IASI instrument, CO2 and O3 SEVIRI channels, followed by some examples of application areas of these.