
Vegetated land
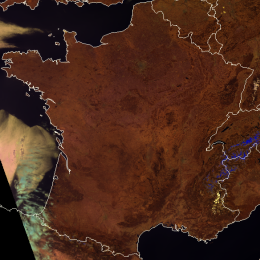
Vegetated land appears brown in the Cloud Phase RGB. The shade of brown depends on the vegetation type and the green vegetation fraction. Denser green vegetation appears darker brown.
The figure below shows the western part of Europe in June both in the Cloud Phase and in the Natural Colours RGBs. In this region green vegetation is rather dense in June. In the Cloud Phase RGB, the cloud-free land appears brown, mostly in medium or dark shades. Mountain regions covered by forest usually appear dark brown.
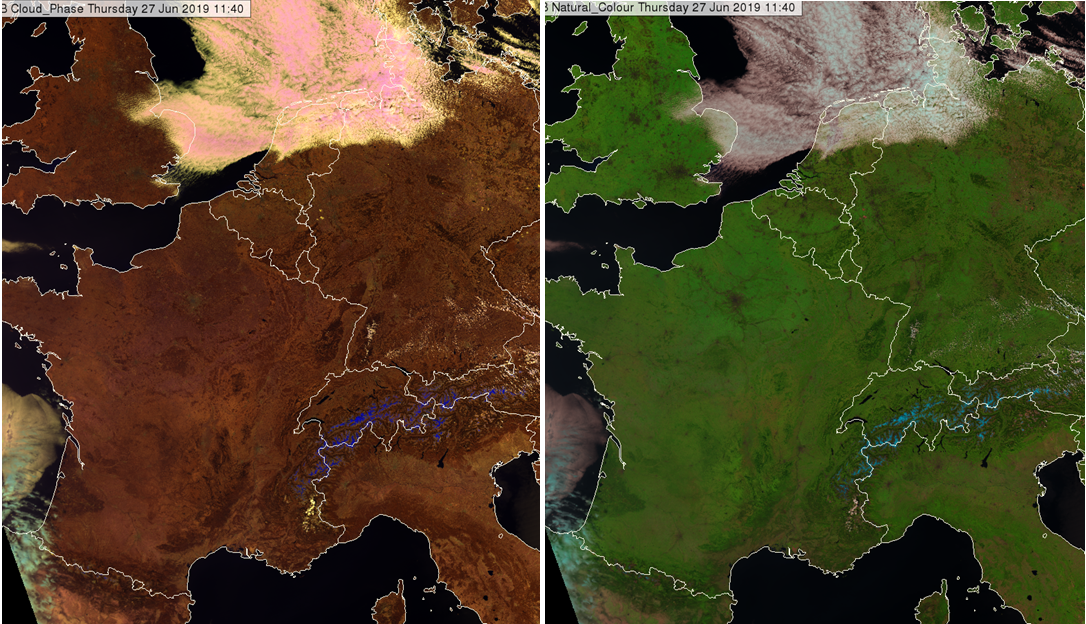
Fig. 1: VIIRS Cloud Phase and Natural Colours RGB images for 27 June 2019, 11:40 UTC
The figure below shows the Crimean Peninsula, the Black Sea and its northwestern coast in June and August. The Natural Colours RGB helps identify the areas covered by green vegetation.
The mountains along the southern coast of the Crimean Peninsula appear darker brown in the Cloud Phase RGB as it is covered mainly by forests. Seventy-five percent of the remaining area of the Crimea consists of semiarid prairie lands (steppe, grass land), which is dominant along the Ukrainian coast of the Black Sea as well. These areas appear brighter brown in June. In August their colours become more yellowish.
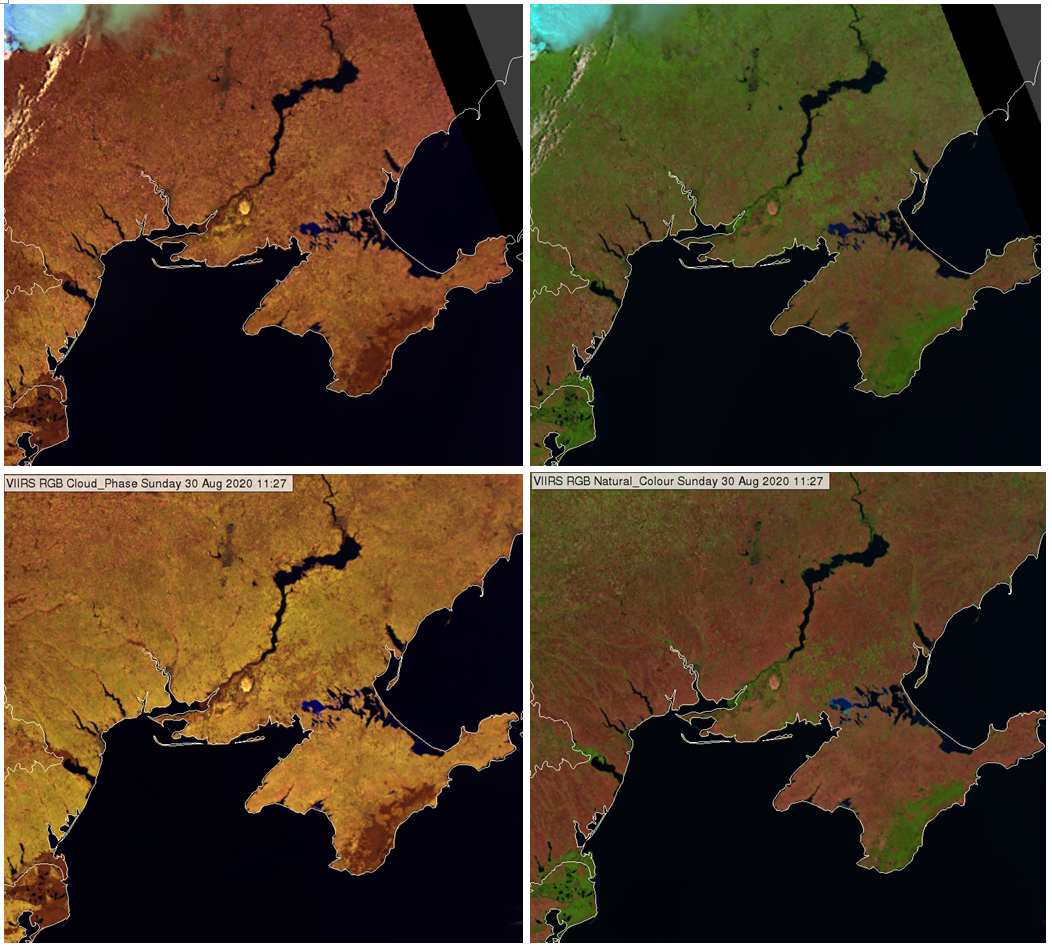
Fig. 2: VIIRS Cloud Phase RGB (upper left) and Natural Colours RGB (upper right) for 27 June 2019, 11:40 UTC. Cloud Phase RGB (bottom left) and Natural Colours RGB (bottom right) for 30 August 2020, 11:27 UTC
The left panel of the figure below shows the Danube Delta, while the right panel shows the Nile Delta.
The Danube Delta is covered mainly by dense green reeds. Some smaller areas are covered by forests. Open water of larger lakes is also present. The Danube Delta appears dark brown because of the mix of dense green vegetation and some pixels over open water. The Nile Delta and the coast of Nile is covered by dense green vegetation.
Fig. 3: The Danube Delta on VIIRS Cloud Phase RGB, 30 August 2020, 11:27 UTC (left) and the Nile River and its delta on VIIRS Cloud Phase RGB, 27 April 2021 11:19 UTC (right)
The image below shows the Iberian Peninsula in September. Areas with dense green vegetation appear dark brown. Areas where the pixels are mixed with bare soil and sparse vegetation appear much lighter brown. The Natural Colours RGB is shown to help to identify the areas covered by green vegetation. The cloud-free area over France appears also lighter brown than in June (see Fig. 1).
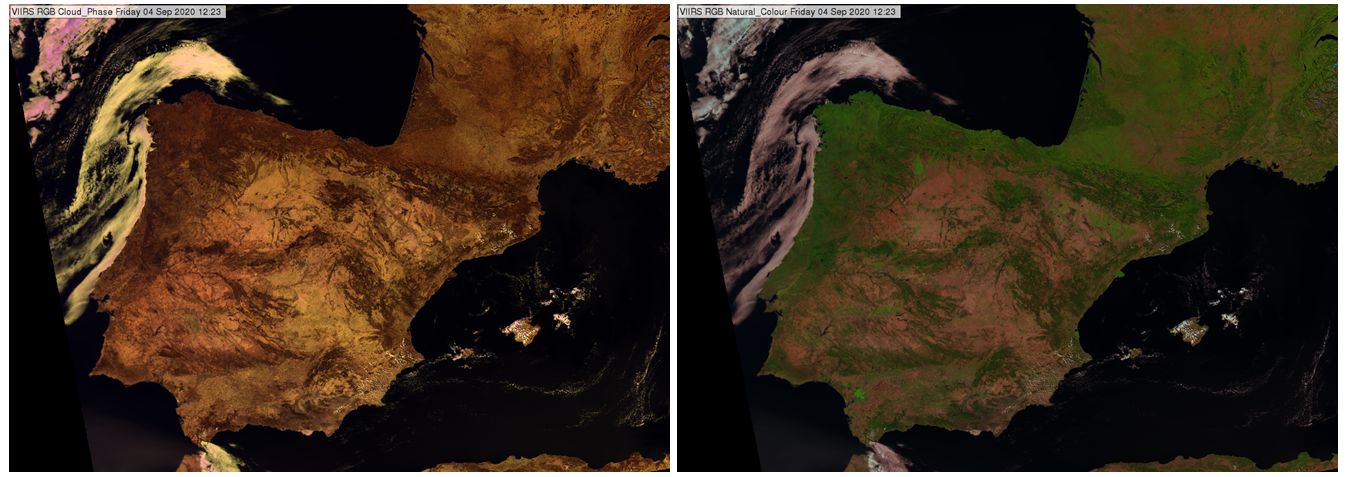
Fig. 4: VIIRS Cloud Phase and Natural Colours RGB images for 04 September 2020, 12:23 UTC
Note:
• Land is seen only in cloud-free areas.
• The brown shades depend on the solar and satellite viewing angles as well.
• Bare soil without green vegetation may appear almost yellow, with some brownish shades depending on the soil type and wetness. Rocky mountains may appear brownish or grey. Sandy deserts is yellow in Cloud Phase RGBs.
Explanation of the colour of vegetated land in the Cloud Phase RGB (see the recipe):
Vegetated land appears brown because the red signal is the strongest and the blue one is the weakest.
• If the pixel is covered by green vegetation then the red signal is the strongest and the blue one is the weakest, see the green vegetation curve in the graph below and the RGB recipe on the left site.
• If the pixel is covered by bare soil then all three signals are stronger, the level of the red and green signal are close to each other, while the blue one is much weaker, see the soil curve in the graph below and the RGB recipe on the left site. As a consequence the colour of the bare soil is lighter and may be close to yellow (depending also on the soil type and wetness).
• If the pixel is covered partly by vegetation and partly by bare soil, then it appears light brown.

Fig. 5: Typical reflectance spectra of green vegetation, soil and water. The central wavelengths of the three channels the VIIRS Cloud Phase RGB is created from are indicated by vertical lines. © CEOS project
Note that sandy deserts appear yellow as the sand curve is similar to the soil curve, but with higher reflectance values.