
Polar Airmass
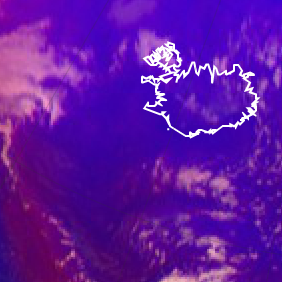
Polar air masses appear blue in the Airmass RGB images.
The blue colour in the Airmass RGB indicates polar air masses characterised by a low tropopause.
Due to higher upper level tropospheric humidity, the brightness temperature difference (BTD) WV6.2-WV7.3, which determines the red colour beam, is large. The scale for the red colour beam is chosen this way, that large BTD lead to small contributions of the red colour. Hence, the red contribution is not 0, but certainly low.
The green colour beam gives no contribution in case of polar air masses. Green stems from the BTD of channels IR9.7 and IR10.8. The larger the difference between both BTD, the smaller the green contribution. The channel IR9.7 is responsive to ozone gas concentration in the lower stratosphere. Polar regions are characterised by a low tropopause level and, hand in hand, by a lower altitude of the ozone rich stratospheric air. As the air mass is ozone rich in the levels where IR9.7 has its contribution maximum, the resulting BTD is large (largely negative).
The main contribution comes from the blue colour beam. Because of the colder atmosphere and the inclined viewing angle, brightness temperatures measured at 6.2 micrometer are rather low.
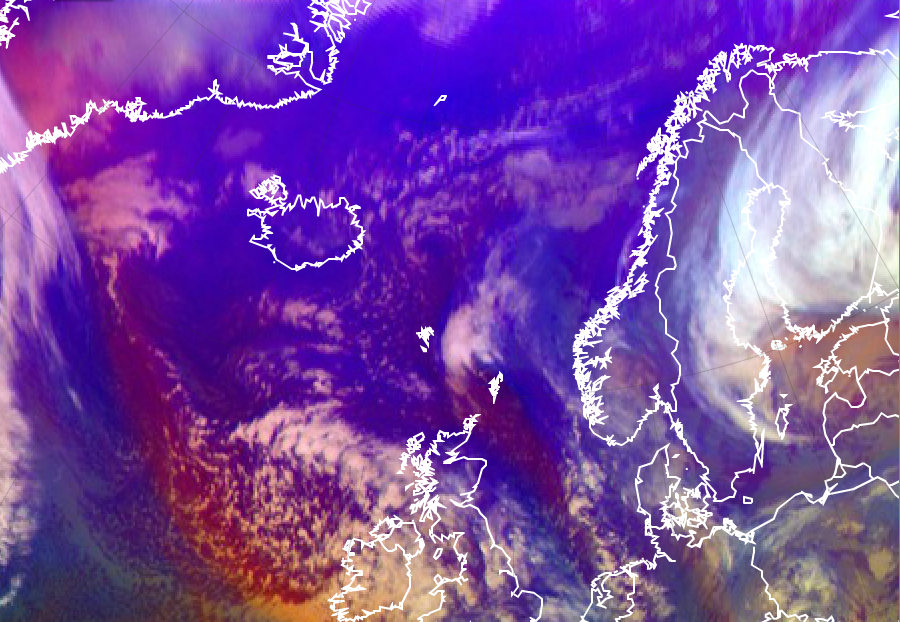
Airmass RGB for 13 January 2016 12:00 UTC
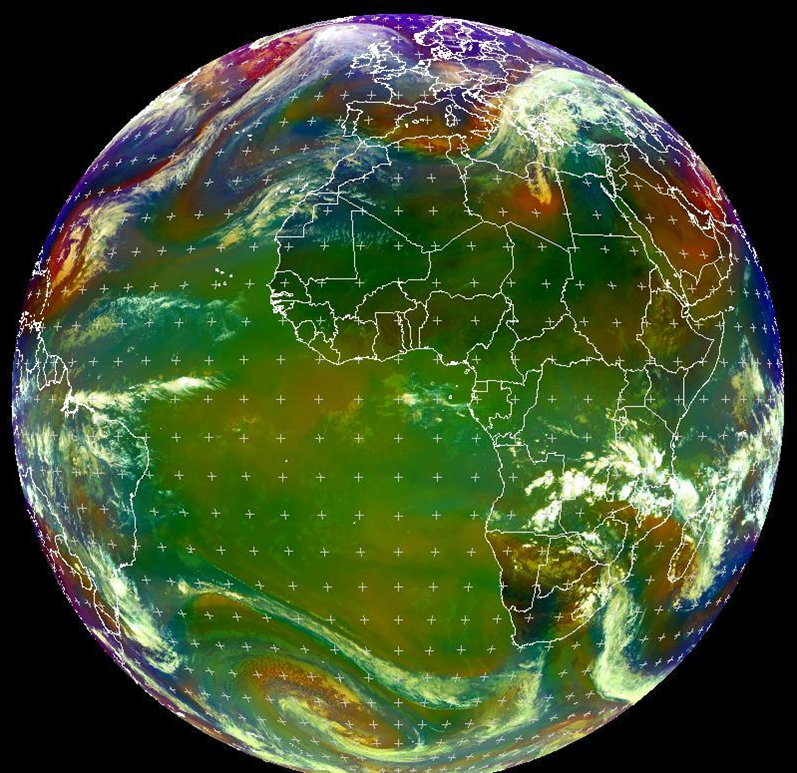
The blue colour in the Airmass RGB can also come from the so-called "limb cooling effect". If the whole disk of the Airmass RGB is plotted, one sees that the blue colour prevails at the image edge even in the tropical regions. Radiation from the image edge (full disk image) traverses a longer path through the troposphere until it reaches the satellite instrument. Therefore, the measured radiances are far smaller than from regions near the sub-satellite point (see image below).
Airmass RGB for 13 January 2016 13:00 UTC
Explanation of the colour of polar airmasses in the Airmass RGB (see the recipe):
• Polar air masses are characterised by their blue colour in the Airmass RGB. This results from a combination of a low tropopause level (cold airmass) and high ozone concentration in the level of highest instrument sensitivity.
• The blue colour can also be caused by the "limb cooling effect" which can be observed in tropical regions at the edge of the full disk scan.