
High opaque clouds
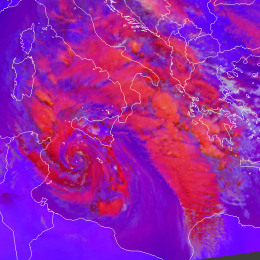
Frontal cloud bands and deep convective clouds without strong updrafts are typically shown in red tones in the Severe Storms RGB images. Examples for frontal cloudiness and cyclones are shown below and left.
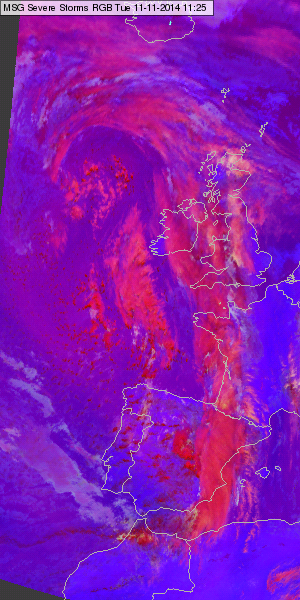
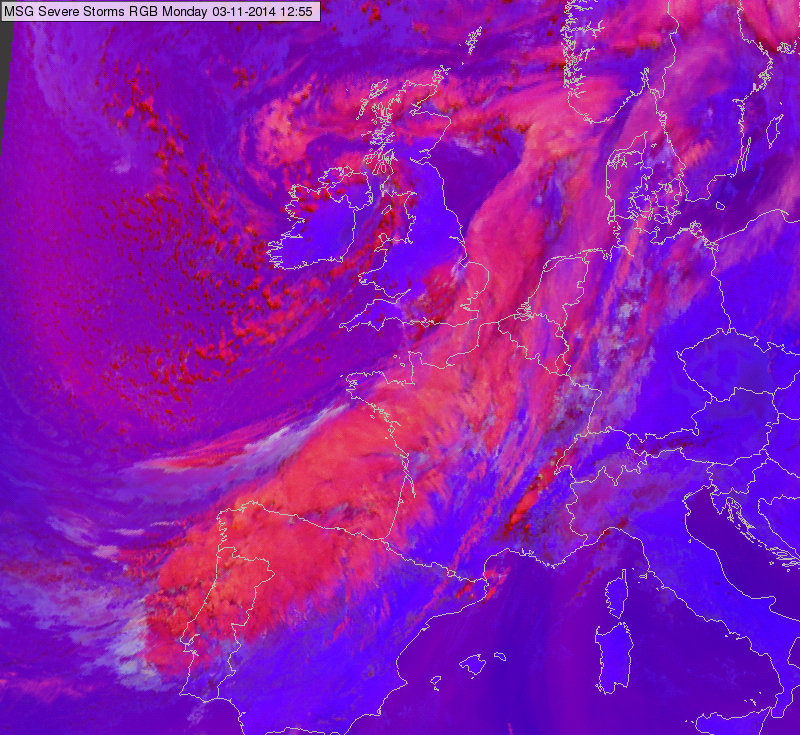
Meteosat, SEVIRI Severe Storms RGB image for 11 November 2014 11:25 UTC (left) and 03 November 2014 12:55 UTC (right)
Note that some parts of the fronts can be yellowish in regions where the cloud top is very cold or it is covered by small ice crystals due to high pollution, or in case of high level lee cloud formation within the cloudiness or embedded convection with strong updraft.
Deep convective clouds are depicted in red colours in case the updraft is not strong (like in the November case below) or they are already in the decaying phase.
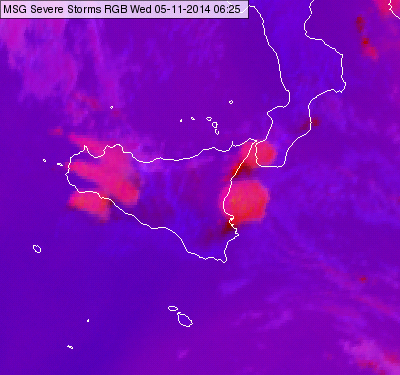
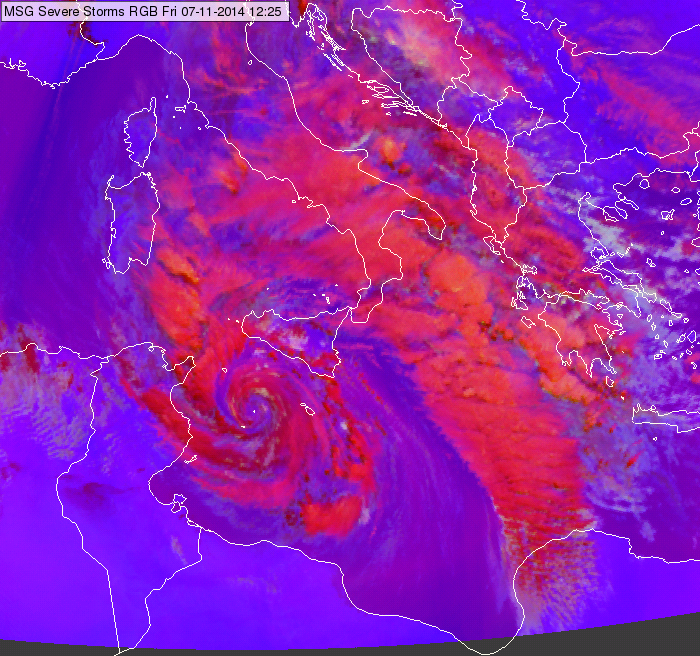
Meteosat, SEVIRI Severe Storms RGB image for 05 November 2014 06:25 UTC and 7 November 2014 12:25 UTC (right)
Explanation of the colours (see the recipe):
• The (WV6.2 – WV7.3) difference is around zero for high thick ice clouds resulting intense signals in the red colour beam.
• The (IR3.9 – IR10.8) difference is low for thick ice clouds (if the cloud top is not very cold and/or not covered by small ice crystals). This difference serves as an approximation of the 3.9 micrometer reflectivity value - large ice crystals reflect only weakly the solar radiation. (Note that this difference depends on the cloud top temperature as well.)
• The (NIR1.6 – VIS0.6) difference is large negative for thick ice clouds because their reflectivity values are much lower around 1.6 micrometer than around 0.6 micrometer. This gives low signal in the blue colour beam.
As a consequence the signal will be intense in red and low in the green and blue colour beams.