
Land
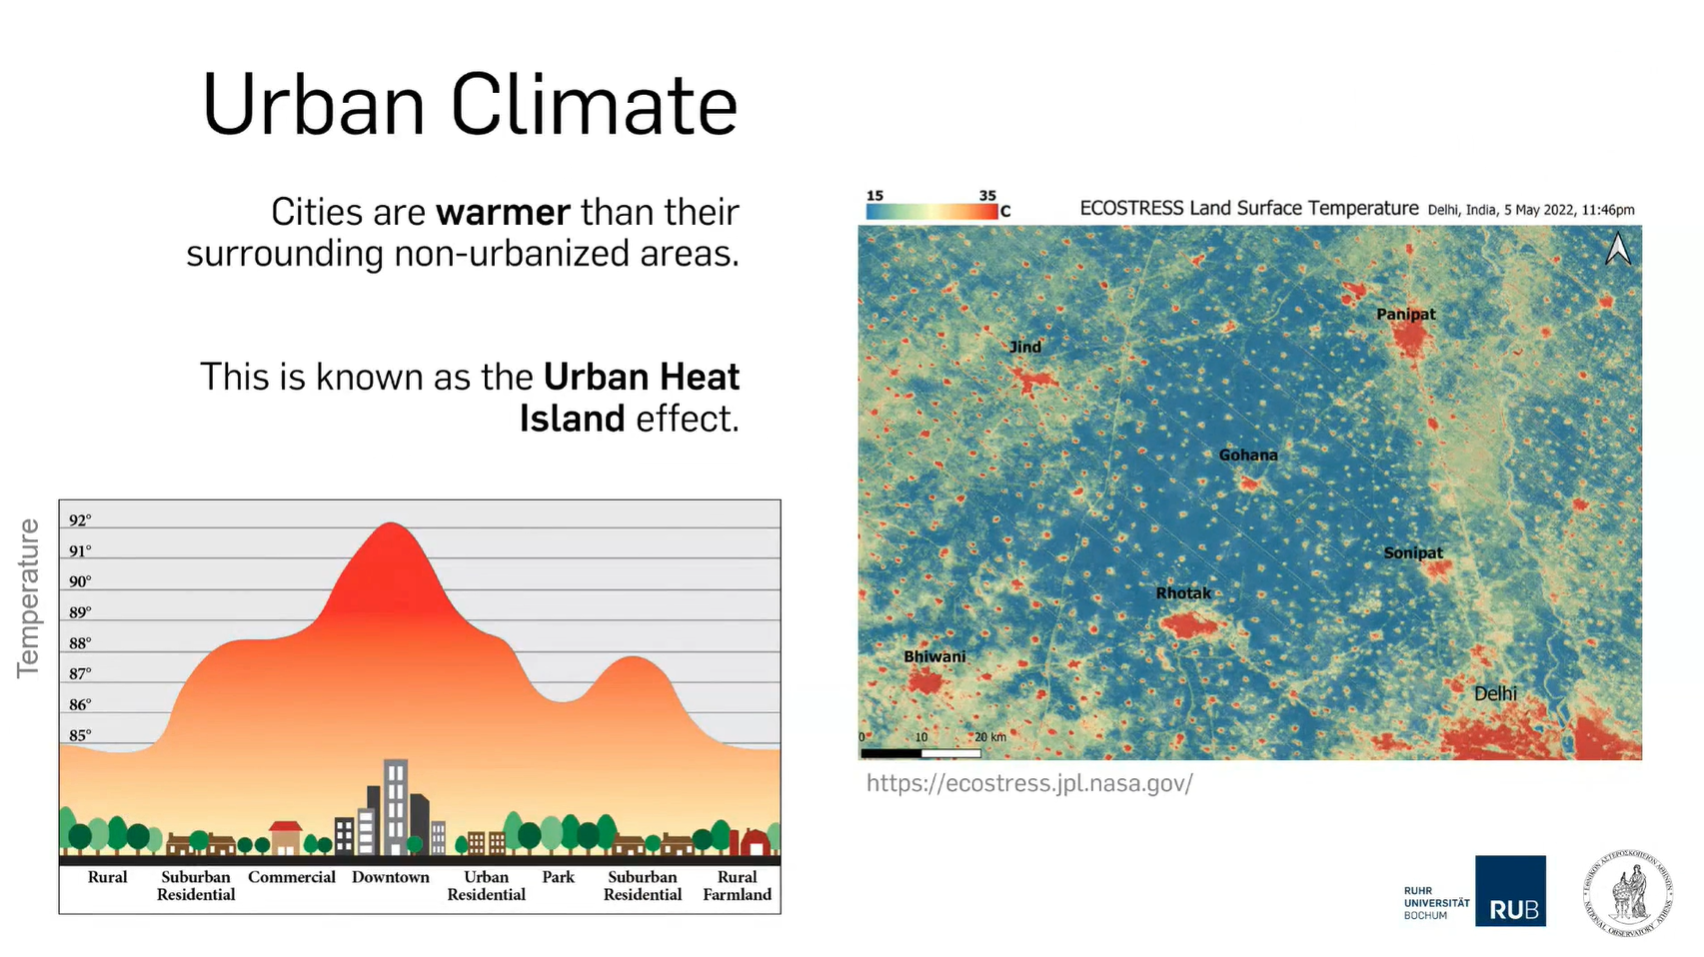
Panagiotis Sismanidis provides insight into urban heat islands including its drivers and impacts.
Cities are generally warmer than their surroundings. This phenomenon is known as the Urban Heat Island (UHI) and is one of the clearest examples of human-induced climate modification. UHIs increase the cooling energy demand, aggravate the feeling of thermal discomfort, and influence air quality. In this talk we will discuss the drivers and impacts of UHIs and showcase how to characterize the urban landscape in Local Climate Zones. We will also discuss the discrepancies between remotely-sensed land surface temperatures (LST) and near-surface air temperatures when studying the urban climate.
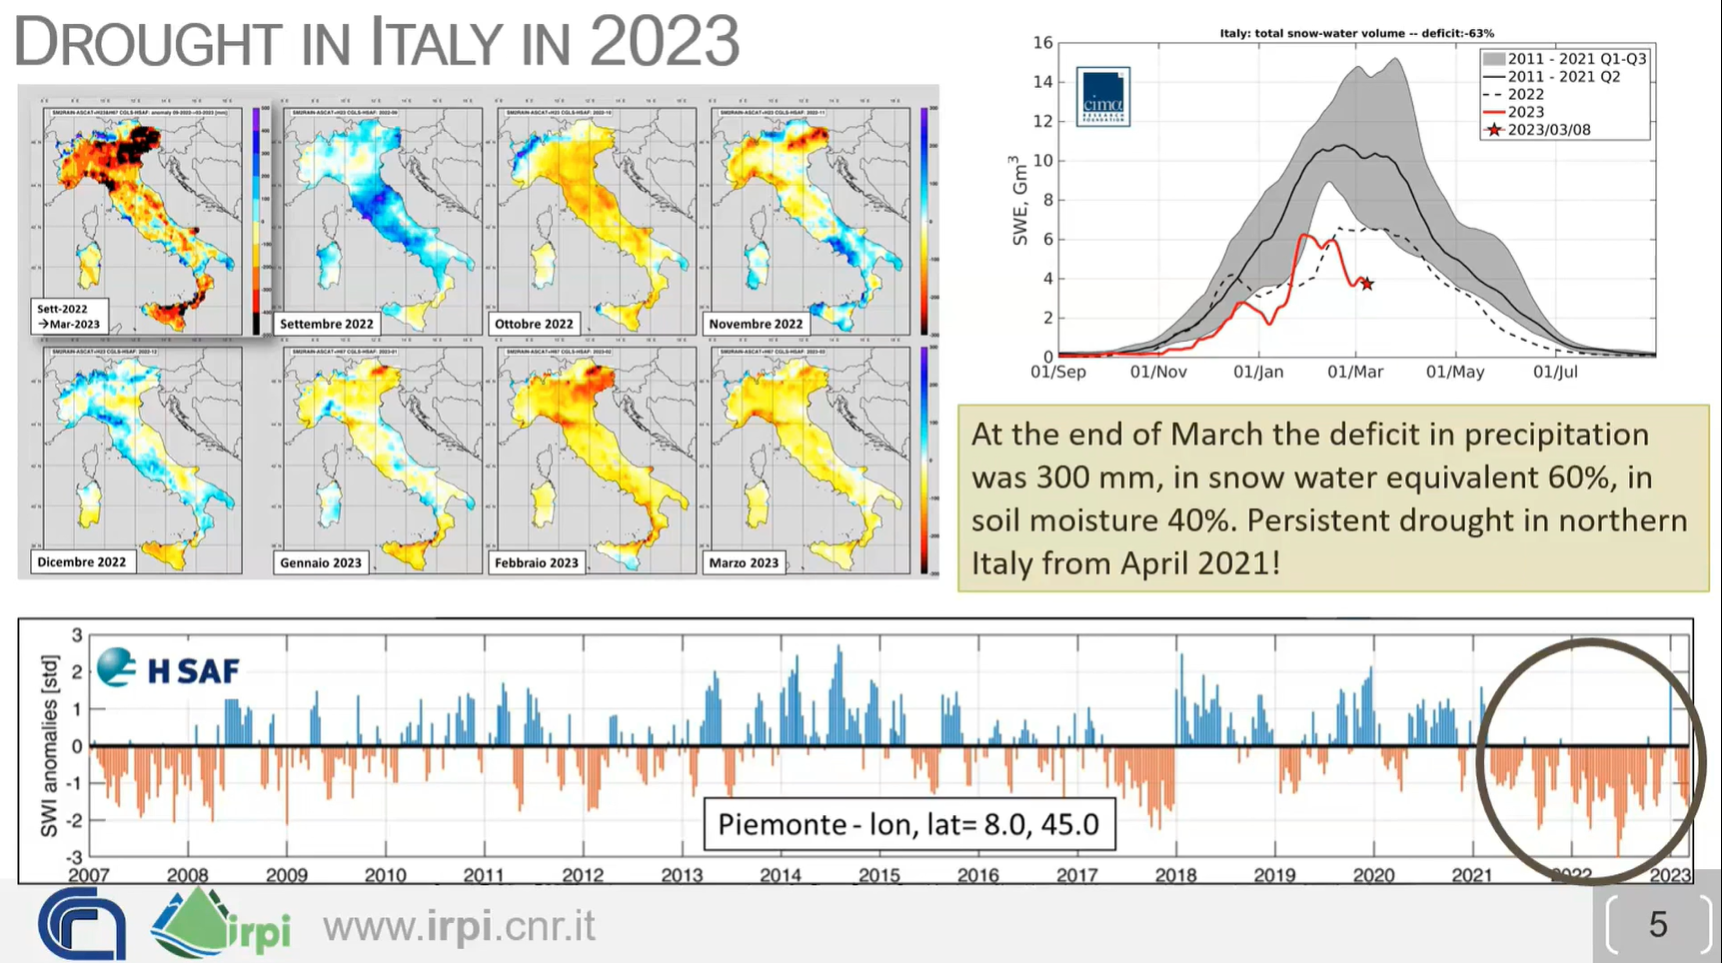
Luca Brocca shows how to combine multiple satellite derived variables to monitor drought.
How do we monitor drought? Is it enough to use only precipitation data and calculate the SPI (Standardized Precipitation Index)? New satellite-derived products (precipitation, evaporation, soil moisture and snow) offer additional ways to monitor drought in space and time, to assess WHERE the water is (surface soil, root zone soil, snowpack), and thus to know WHEN the water will be available. Real-world case studies will be analyzed together with the participants, also using an interactive platform (https://explorer.dte-hydro.adamplatform.eu/). The objectives of the lecture are: (1) to assess drought risk based on (new) satellite observations, and (2) to translate drought risk information into real-world decisions for water resources management (e.g., reservoir management, irrigation, hydropower generation).
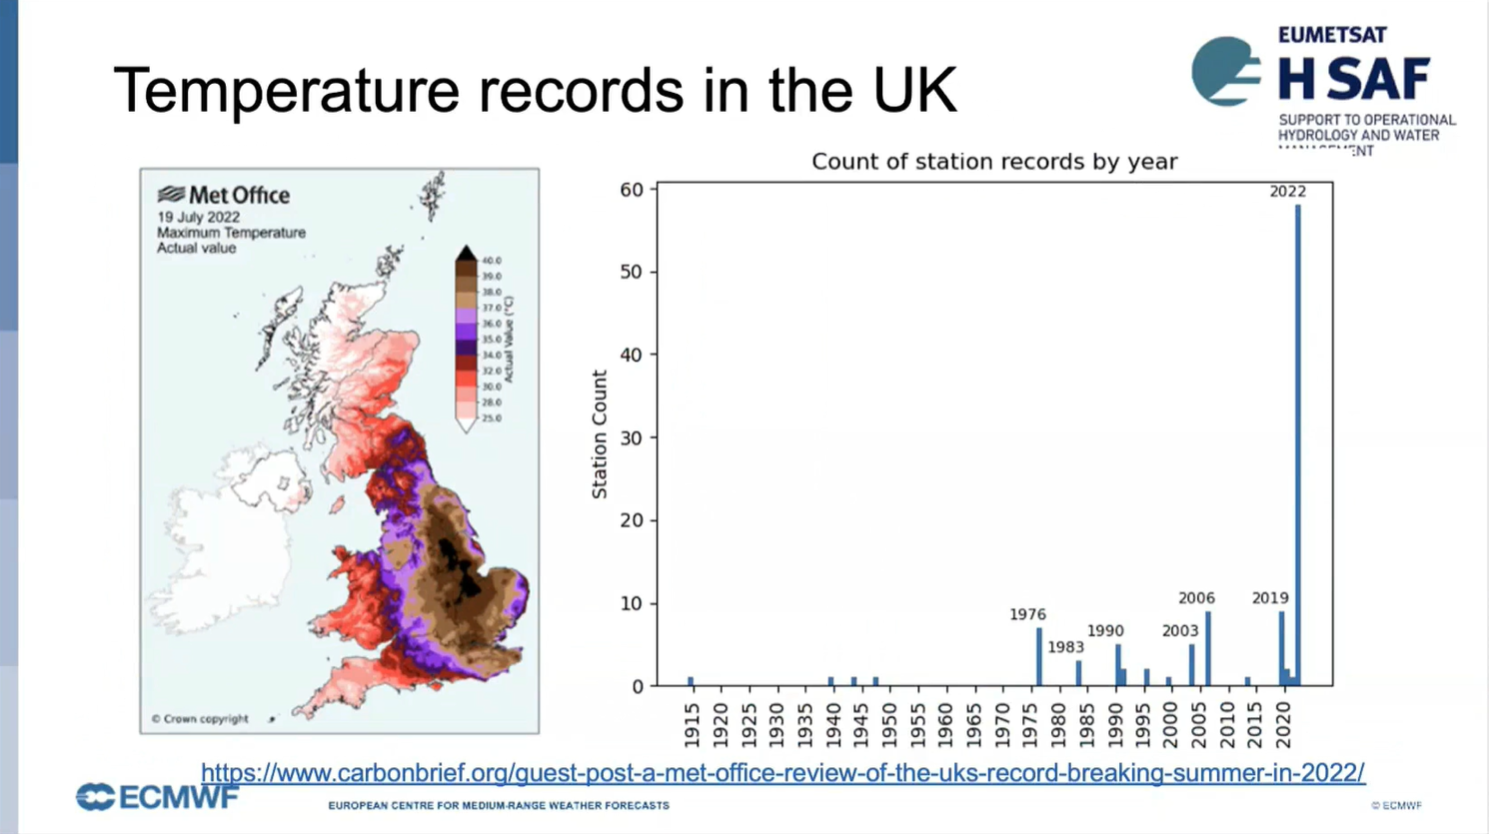
David Fairbairn talks about soil moisture and drought monitoring and using H SAF datasets.
H SAF soil moisture (SM) products are derived from ASCAT C-band backscatter measurements. In this presentation we compare the near-real-time products with long-term data records in order to demonstrate the exceptional severity and extent of recent droughts, including the 2022 summer drought over Europe.
João Martins talks about using Land Surface Temperature (LST) in heatwave monitoring using LSA SAF datasets.
Heat and water stress leave clear signatures on land surface variables that can be monitored from space. The LSA SAF has been providing satellite datasets and products that allow the characterization of the surface energy budget and the monitoring of vegetation growth and stress. We will show that combining information on the surface temperature diurnal cycle and on vegetation state provides a different perspective on the spatial extent and time evolution of droughts and heatwaves, and reveals underlying soil vegetation-atmosphere feedbacks.
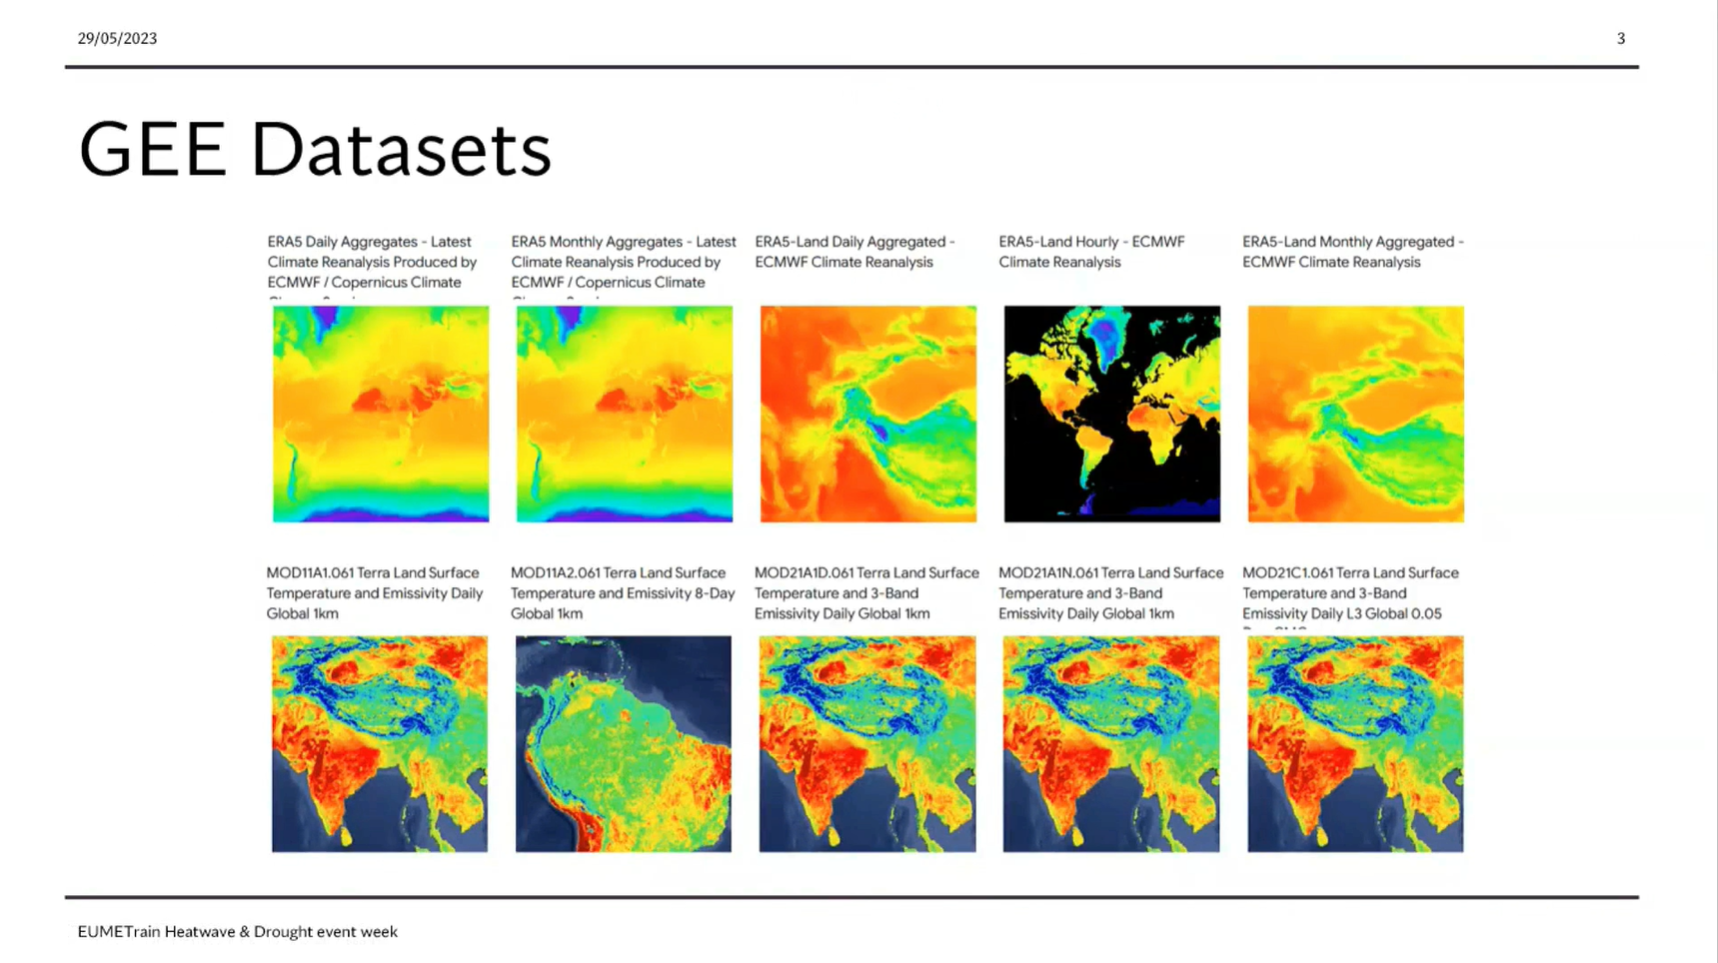
Sofia Ermida showcases the use of Google Earth Engine in Heatwaves and Drought monitoring
The Google Earth Engine (GEE) is a powerful tool for researchers providing easy access to a large array of environmental datasets, particularly from remote sensing, and the computational resources to analyzed them. Here we present an overview of the capabilities and datasets of the GEE useful for the study of heatwaves and droughts and provide some examples of applications.
Learn to distinguish between dust and smoke.
This module teaches you how to use satellite data to observe and analyze atmospheric phenomena. It will show you which products can be used to identify dust storms, smoke, fires, precipitation, etc.
To access the resource click here.
Note: all resources are provided as an external link which redirects you to https://eumetcal.eu where you will need to create a user account in order to gain access to the course
Identify and locate fires and smoke.
This module teaches you how to use satellite data to observe and analyze atmospheric phenomena. It will show you which products can be used to identify dust storms, smoke, fires, precipitation, etc.
To access the resource click here.
Note: all resources are provided as an external link which redirects you to https://eumetcal.eu where you will need to create a user account in order to gain access to the course
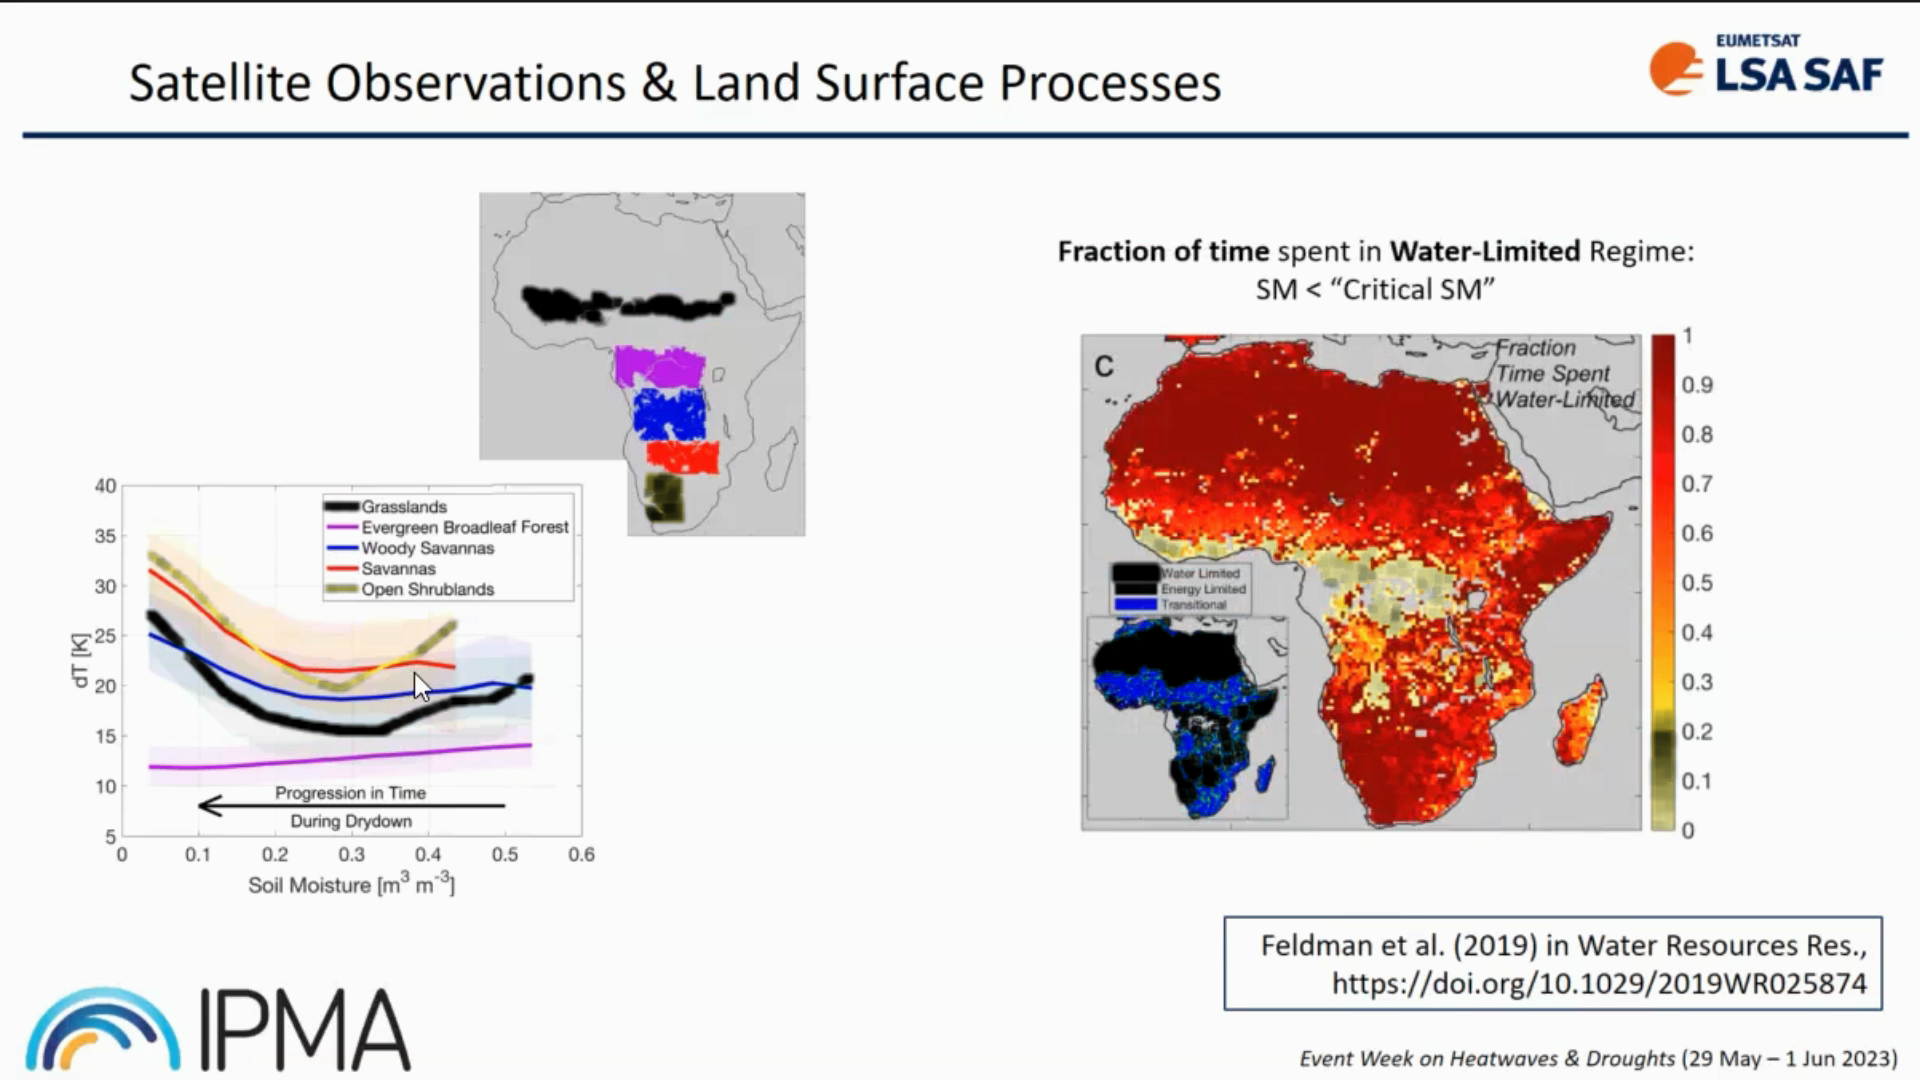
Isabel Trigo provides insight into LSA SAF datasets and its usage.
Heat and water stress leave clear signatures on land surface variables that can be monitored from space. The LSA SAF has been providing satellite datasets and products that allow the characterization of the surface energy budget and the monitoring of vegetation growth and stress. We will show that the combination of information on the surface temperature diurnal cycle and on vegetation state provides a different perspective on the spatial extent and time evolution of droughts and heatwaves, and reveals underlying soil vegetation-atmosphere feedbacks.
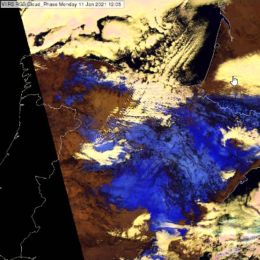
This case study treats snow detection with the Cloud Phase RGB.
During 07-10 January 2021, a winter storm produced a significant 30-50 cm snow depth over large parts of Spain. We studied this snow cover over the following ten days in VIIRS Cloud Phase RGB images. The Cloud Phase RGB is a composite image, which will also be available with data from the future Meteosat Third Generation (MTG) imager.
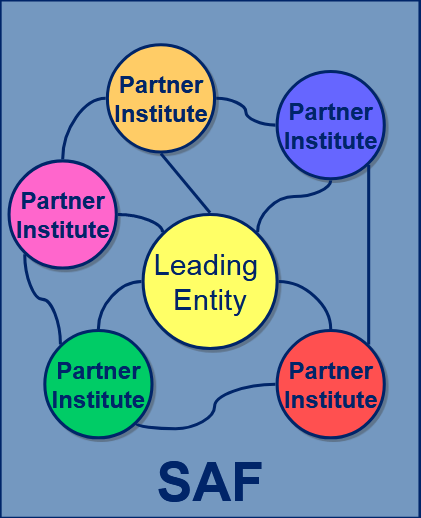
Lothar Schueller gives an overview on the SAF structure and the generated products.
Length: 30 minutes.
SAFs are dedicated centres of excellence for processing satellite data, achieved by utilising specialist expertise from the Member States. SAFs generate and disseminate operational EUMETSAT products and services and are an integral part of the distributed EUMETSAT Application Ground Segment.
Each SAF is led by the National Meteorological Service (NMS) of a EUMETSAT Member State, in association with a consortium of EUMETSAT Member States and Cooperating States, government bodies and research institutes. The lead NMS is responsible for the management of each complete SAF project. The research, data and services provided by the SAFs complement the standard meteorological products delivered by EUMETSAT’s central facilities in Darmstadt, Germany.
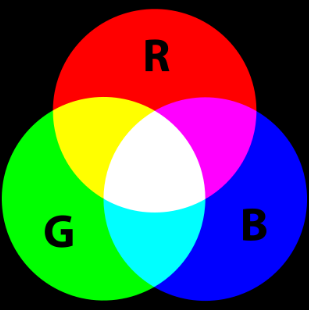
Maria Putsay talks about how to create an RGB image, how to extract, distill, and package the data into products that are easy to interpret and use for forecasters.
Length: 60 minutes.
What is the benefit to work with RGBs not only with single channel images? How to create an RGB image from raw data? How to create a good RGB image? How to enhance features and which features to enhance? Why use standard RGBs? How to extract, distill, and package the data into products that are easy to interpret and use for forecasters?
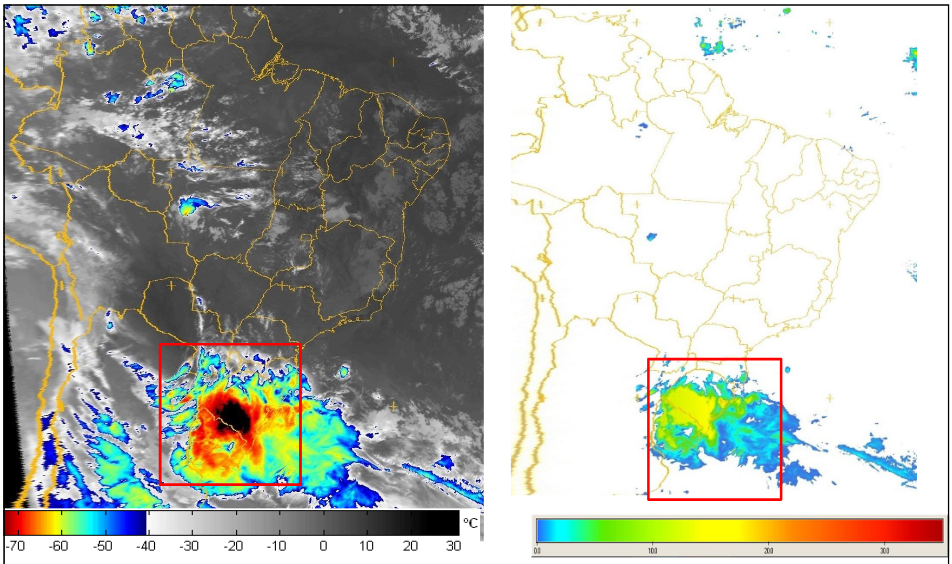
Humberto Barbosa talks on the use of satellite precipitation products for mapping land slides in Brazil.
Length: 50 minutes.
Research during the past decade has documented the importance of satellite precipitation products to the overall workings of the tropical landslide susceptibility. Several types of satellite precipitation products are used for landslide assessment but the area they see, and the frequency of observations, varies. Two complementary types are particularly relevant to landslide management. Polar-orbiting satellites fly in a relatively low orbit (often at around 1000km above the ground), providing relatively high spatial resolution. But they only collect data over the same point once every few days. Geostationary satellites are positioned at a much higher altitude (about 36,000km). They orbit the Earth at the same speed as the Earth rotates on its axis, in effect remaining stationary above the ground and viewing the whole earth disk below. Their spatial data is much coarser, but is collected at the same point every 15 minutes. Moreover, rainfall-triggered landslides tend to be local-scale features, but ground conditions are also very important. When they destroy people's lives and livelihoods, they become natural disasters. Thus, Understanding the nature of spatial and temporal variability of rainfall events in developing countries is important to improve the landslide-prediction science. This seminar will present an overview of recent landslide examples in Brazil and applications of satellite precipitation products. A key satellite input dataset for the integrated applications is the EUMETSAT’s Satellite Application Facility on Support to Operational Hydrology and Water Management.