Chapter V: AVHRR Cloud RGB
Table of Contents
Aim
Cloud RGB images are created by combining data from three different channels. The 0.63 micrometer channel (VIS0.63) data is visualized in red, the 0.87 micrometer channel (NIR0.87) data in green and the 10.8 micrometer channel (IR10.8) data in blue. This is also a daytime RGB as it uses shortwave channels.
In cloudy areas it provides information on cloud thickness and cloud top temperature, and in cloud-free areas on green vegetation fraction ('chlorophyll content').
This RGB type is most useful during the convection period. The core and anvil of convective clouds are seen clearly. Thick and thin high-level clouds are easy to distinguish from each other and from other cloud types and land features, while mid- and low-level clouds and snow-covered land have similar colors.
Because the colors are (relatively) close to the natural colors of their respective features, images are easy to understand and convenient for the public.
Physical background
Distinguishing clouds by their thickness and cloud top temperature
Cloud RGB images contain information on cloud optical thickness and cloud top temperature.
In cloudy areas the VIS0.63 and NIR0.87 channel values depend mainly on the thickness of the clouds. Their reflectivity values are high for opaque and lower for semi-transparent clouds.
The IR10.8 channel distinguishes thick clouds by to their cloud top temperatures. IR10.8 is an atmospheric window channel (where the absorption of the gas molecules is low). For opaque clouds the measured signal depends mainly on cloud top temperature. For semi-transparent clouds the interpretation of the measured radiation is more complicated and depends on the cloud's transparency and the temperature of the underlying surface in addition to the cloud's own temperature.
Distinguishing cloud-free areas with different green vegetation fractions
The NIR0.87 and VIS0.63 channels together provide vegetation information. The reason is demonstrated in Fig. 1: the reflectivity of green vegetation differs considerably in the two channels. More green in a Cloud RGB means that the pixel is covered by vegetation containing more chlorophyll.
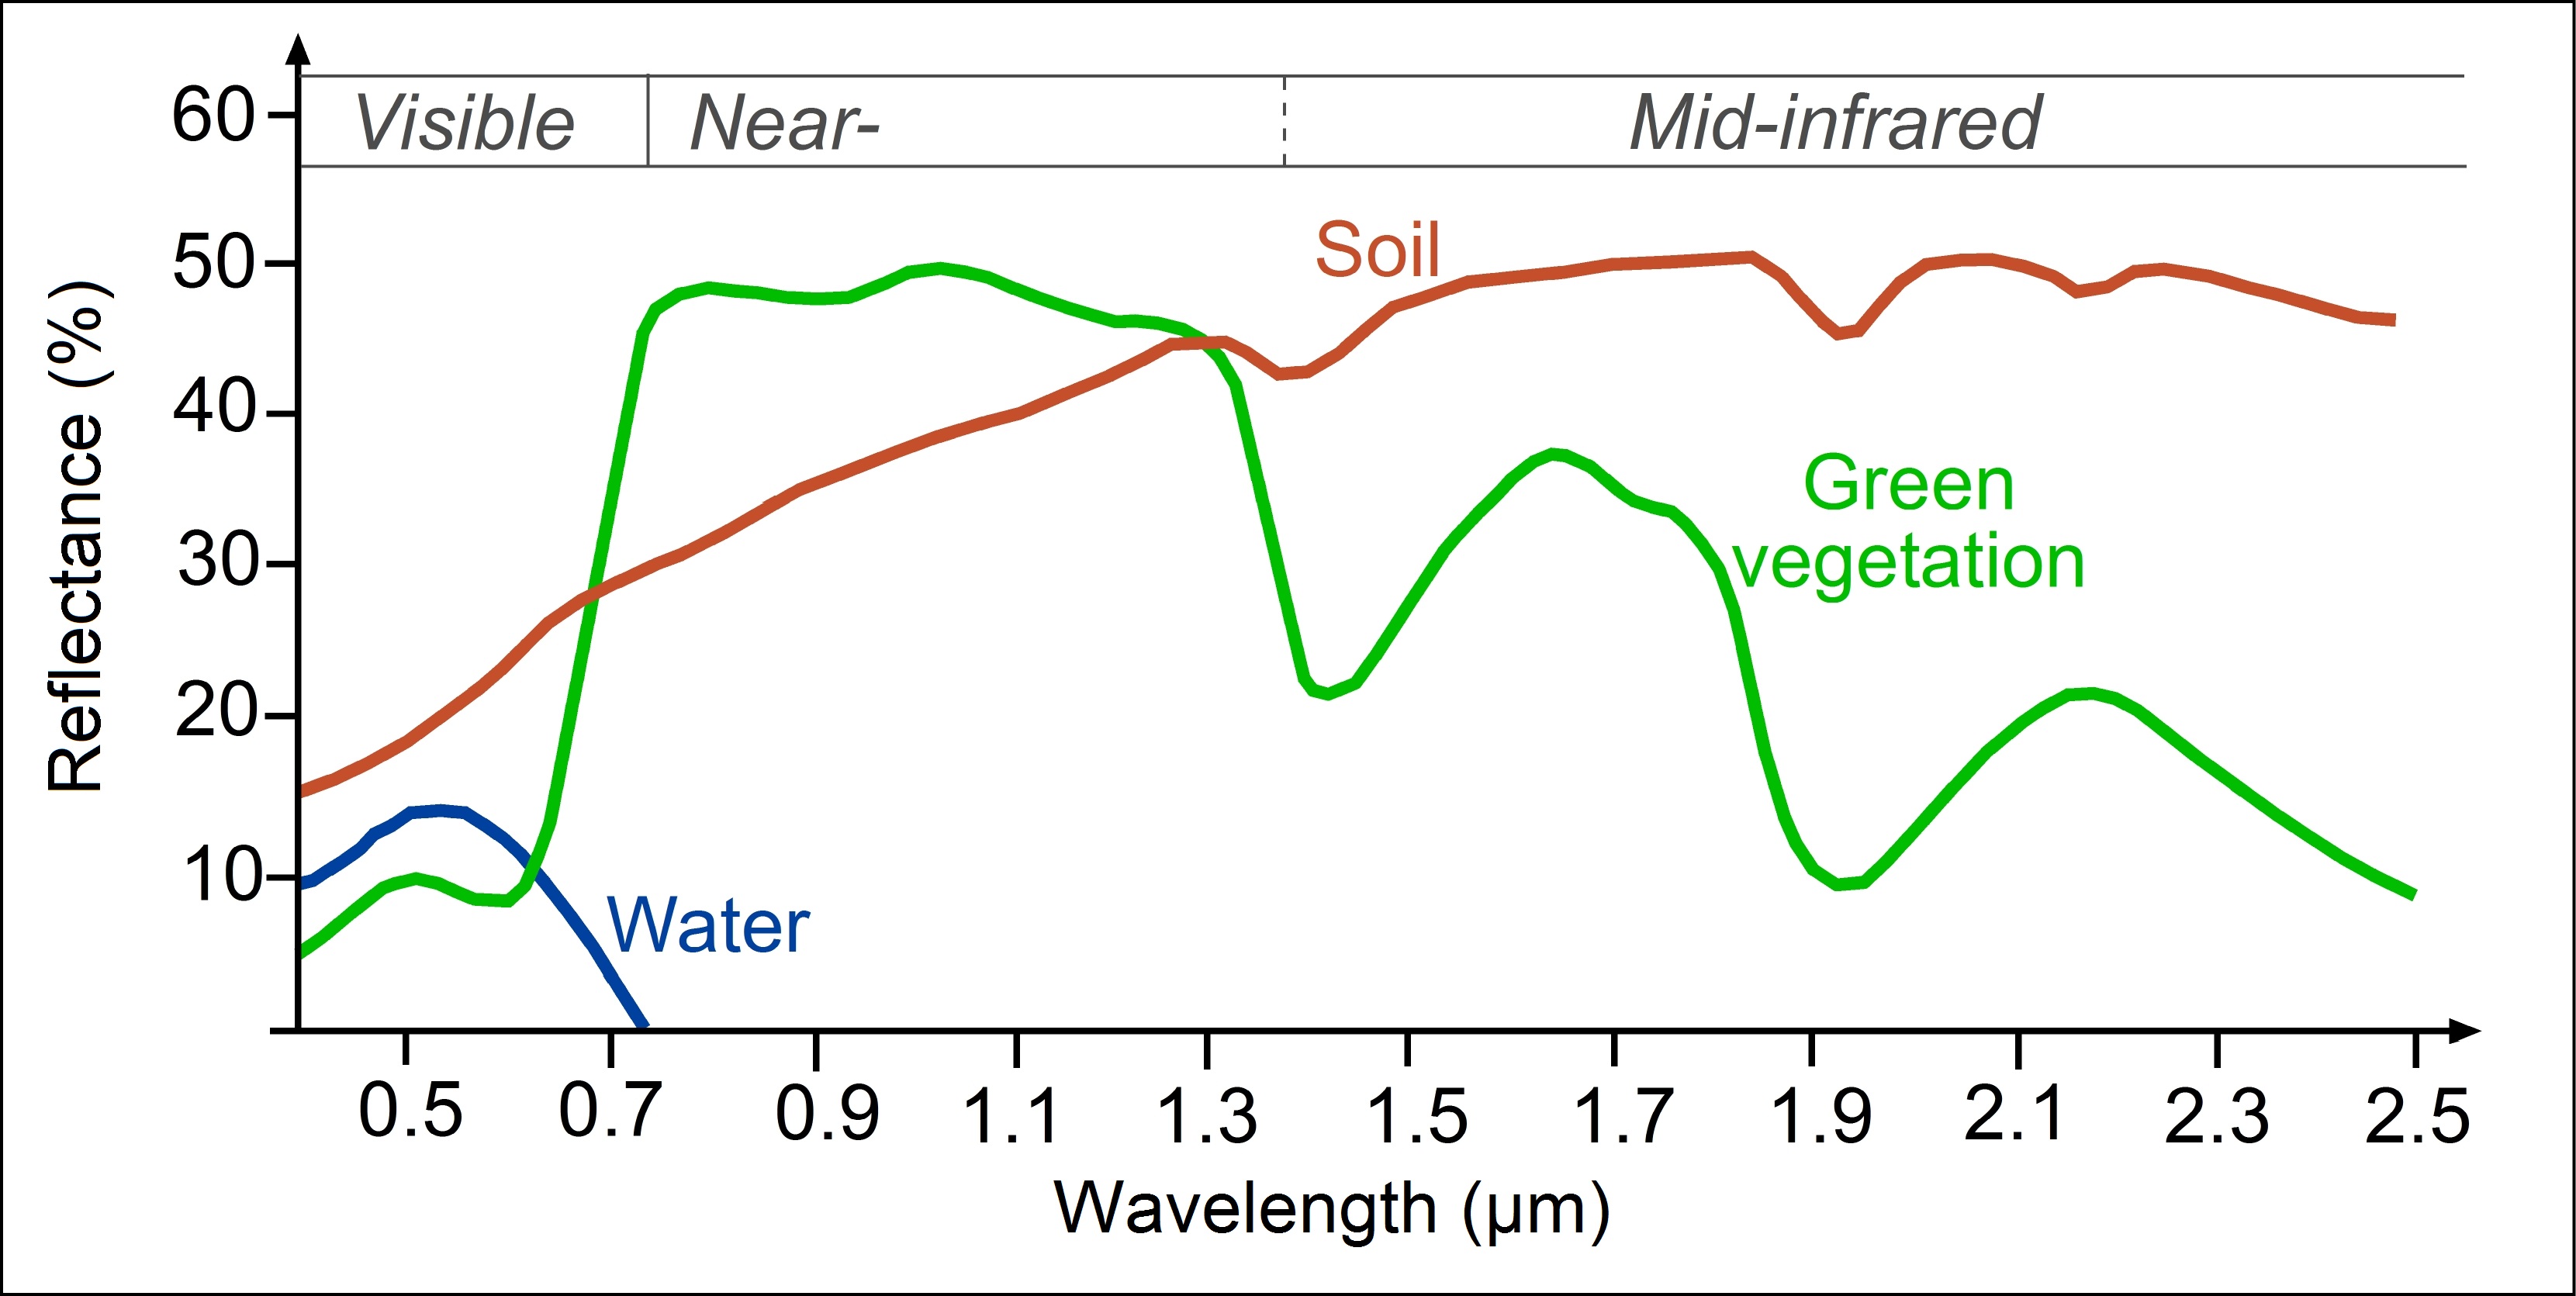
Figure 1: Typical reflectivity functions of green vegetation and bare soil (green and brown curves) in the shortwave spectral region
How to create Cloud RGB images
The 'recipe' of the Cloud RGB type is summarized in Table 1. It shows which channels are visualized in which color. The measured values should be calibrated to brightness temperature or reflectivity. (The reflectivity values should be normalized by the cosine of the solar zenith angle.) The images are then enhanced - linearly stretched - within the ranges shown in the table.
| AVHRR Cloud RGB | ||||
|---|---|---|---|---|
| Color | Channel | Range | ||
| Red | VIS0.63 | 0 | 100 | % |
| Green | NIR0.87 | 0 | 100 | % |
| Blue | IR10.8 inverted | 323 | 203 | K |
Table 1: Recipe of the AVHRR Cloud RGB scheme
The following examples show how the Cloud RGB is combined from the VIS0.63, NIR0.87 and IR10.8 images. They show both the resulting RGB image and its components, which are enhanced according to Table 1. IR10.8 images are bright for low and dark for high brightness temperatures.
Figs. 2a, 2b and 2c show a non-convective situation. Mid- and low-level clouds are yellow. Thick high-level clouds appear white. Thin high-level clouds appear bluish. The snow-covered Alps appear yellow with some red tones. The images are from April and the snows are melting, which gives them a lower reflectivity in the NIR0.87 channel than in VIS0.63 (see the curve 'wet snow' in Fig. 2 of chapter 'AVHRR Natural Colour RGB').
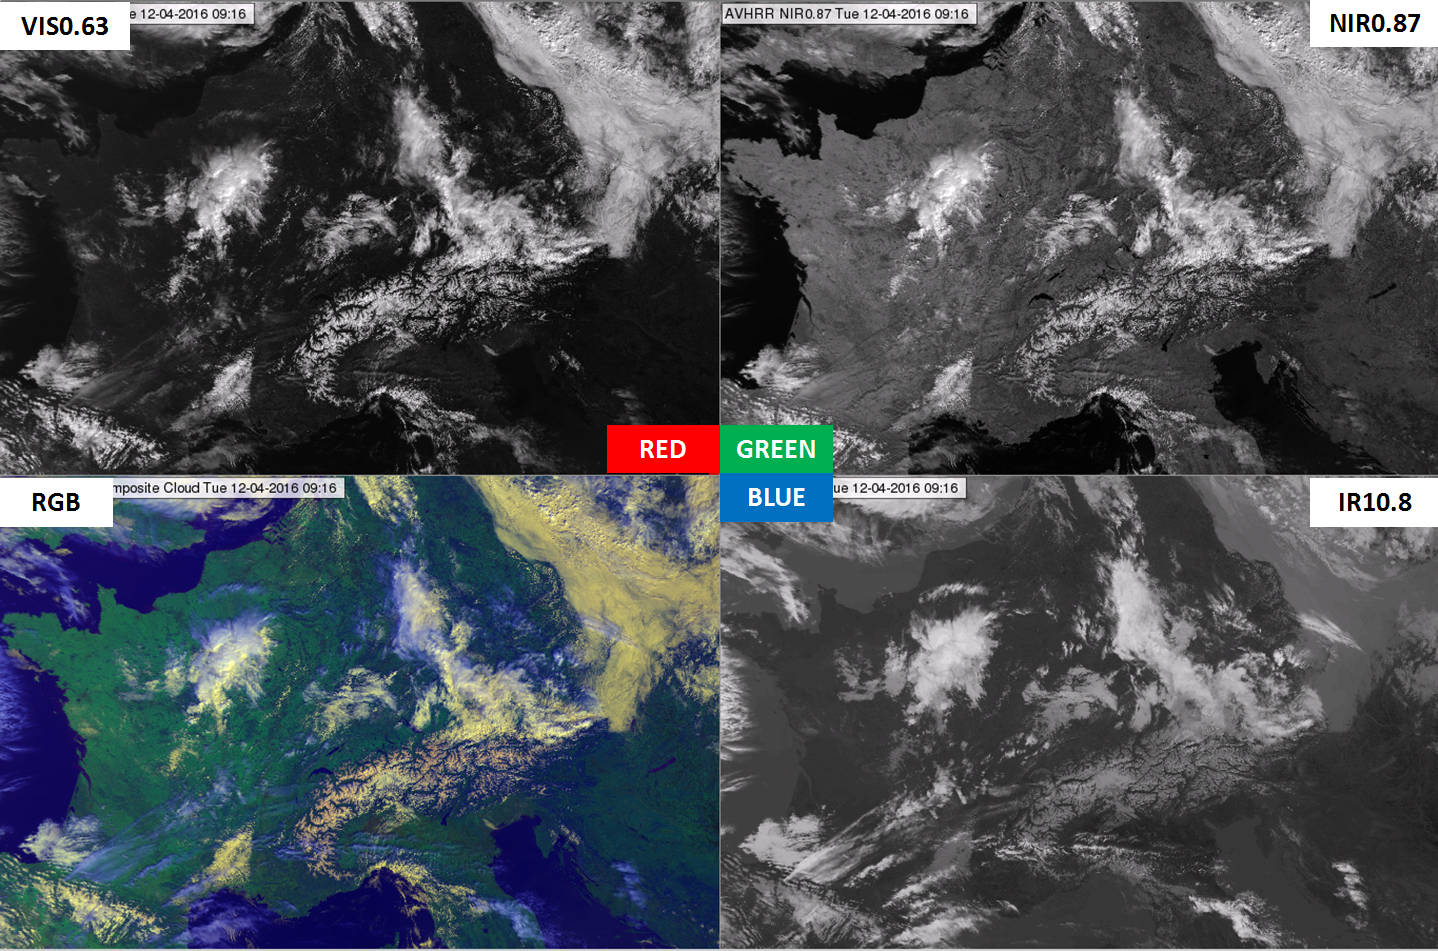
Figure 2a: METOP-A AVHRR VIS0.63 (upper left), NIR0.87 (upper right), Cloud RGB (bottom left) and IR10.8 (bottom right) images on 12 April 2016 at 09:16 UTC
Fig. 2a shows the color components of a Cloud RGB image - the channels which are in the recipe with the corresponding enhancement. The lower left panel shows the Cloud RGB.
Fig. 2b is the same as Fig. 2a except that the three components are visualized in scales of black to red, black to green and black to blue. This is how the three components are used together in the RGB.
Fig. 2c shows the four panels of Fig. 2a on top of each other. Hover your mouse over the image to use the slider.
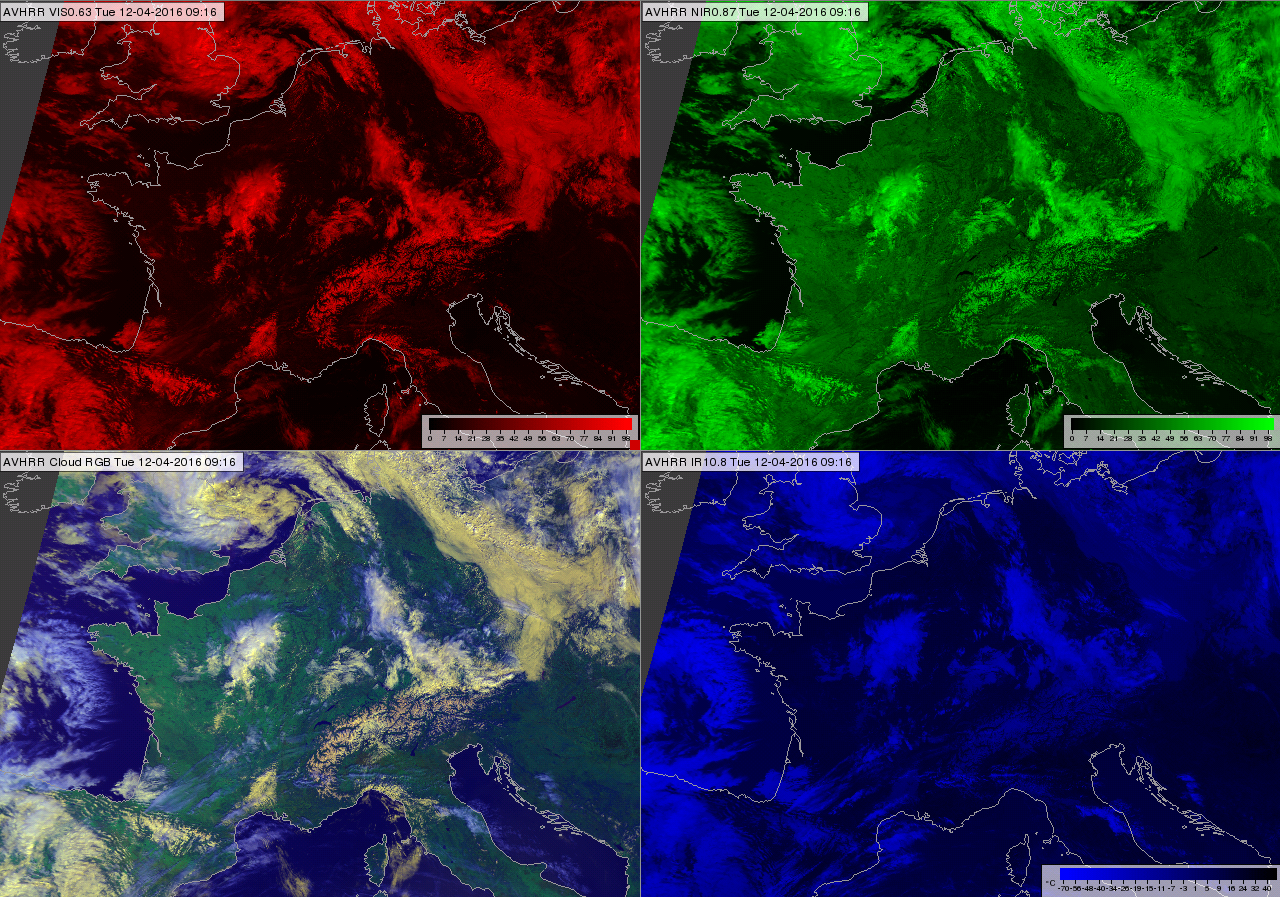
Figure 2b: METOP-A AVHRR VIS0.63 (upper left), NIR0.87 (upper right), Cloud RGB (bottom left) and IR10.8 (bottom right) images on 12 April 2016 at 09:16 UTC
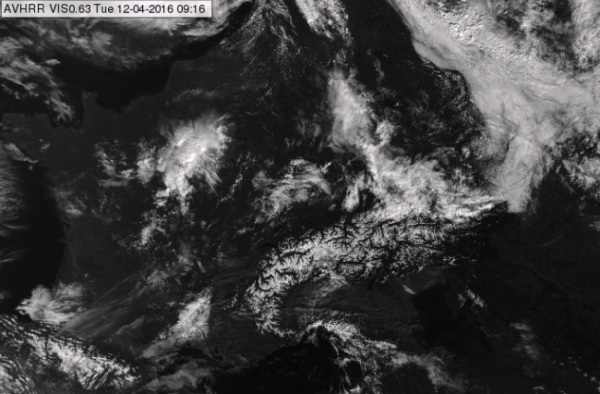
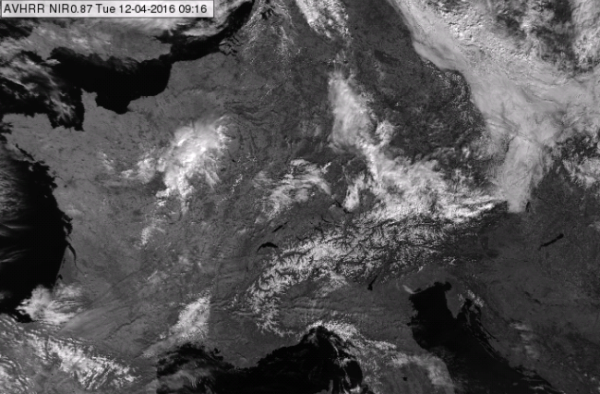
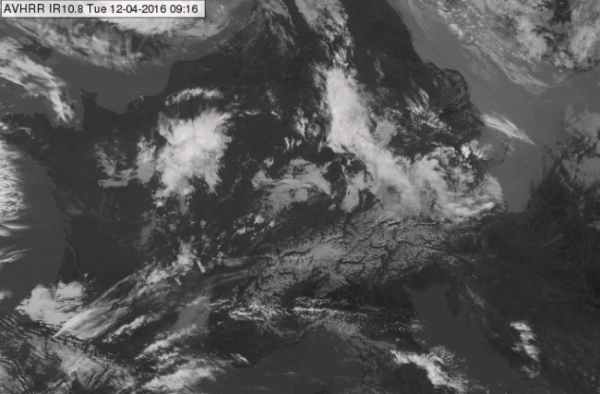
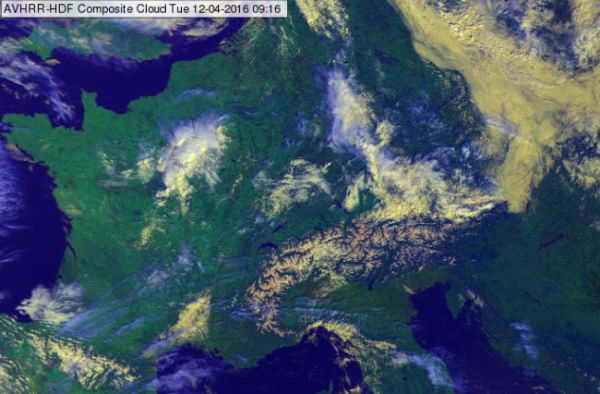
Figure 2c: 4-Panel display, please use your mouse to compare the four images. METOP-A AVHRR VIS0.63, NIR0.87, Cloud RGB and IR10.8 images on 12 April 2016 at 09:16 UTC
Fig. 3 shows convective clouds. The cores of the mature storms are white in the Cloud RGB as they are cold and their reflectivity values are high. The semi-transparent anvils are bluish - their reflectivity is lower, their brightness temperature is warmer, while the blue component is still dominant. (Semi-transparent cirrus clouds show better in thermal infrared than the shortwave spectral region.) The overshooting tops are visible because of their shadows. Some lower level clouds are also seen in the southern part of the image. Their high reflectivity and medium brightness temperature gives them a yellow color.
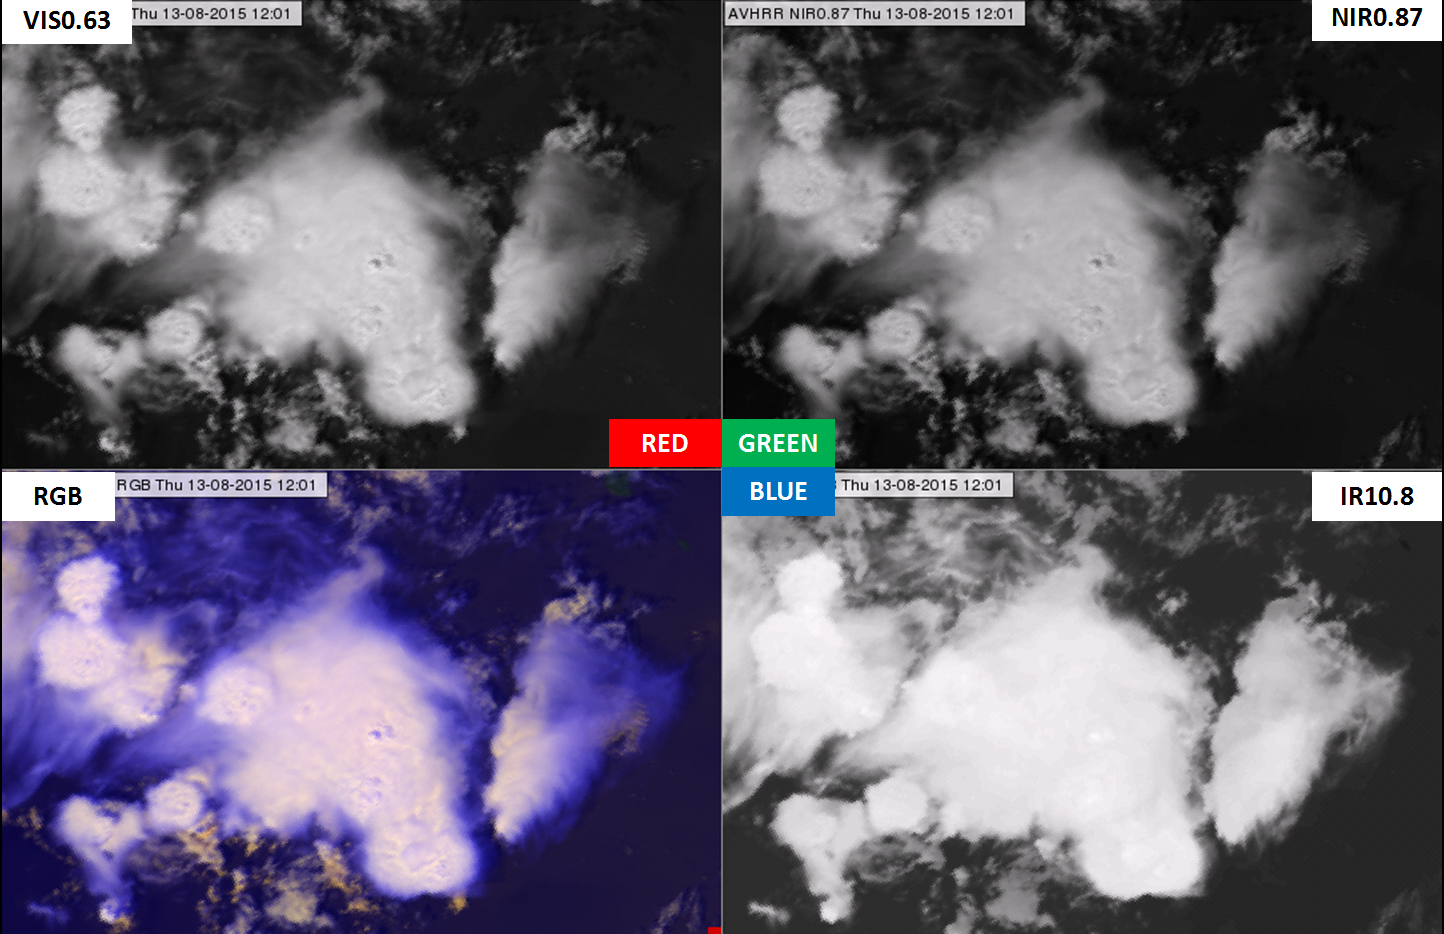
Figure 3: AVHRR VIS0.63 (upper left), NIR0.87 (upper right), Cloud RGB (bottom left) and IR10.8 (bottom right) images on 13 August 2015 at 12:01 UTC
Typical colors
Fig. 4 shows the typical colors of Cloud RGB images. These are just examples, and many other colors and tones are possible. Note that the brightness and shades of the colors may vary across the swath. For more on this, see the chapter 'Effects of the scanning geometry'.
Clouds:
- high-level thick cold clouds are white
- high-level thin cirrus clouds are bluish
- thick medium- and low-level clouds are yellowish
Cloud-free areas:
- Open water surfaces (sea, ocean, big deep lakes) are medium blue - except for increased aerosol content (like dust clouds) or sunglint.
- Ice-covered seas are yellowish (melting ice is yellow with some reddish tones)
- Snow on land appears yellowish (melting snow is yellow with some reddish tones)
- The color of snow-free land reflects the green vegetation fraction ('chlorophyll content'): more vegetation - more green. However, it also depends on temperature.
- warm vegetated area - bright green
- cold vegetated area (e.g. mountains) - bluish green
- bare soil - greyish (with bluish tones in cold areas)
- desert - yellowish green
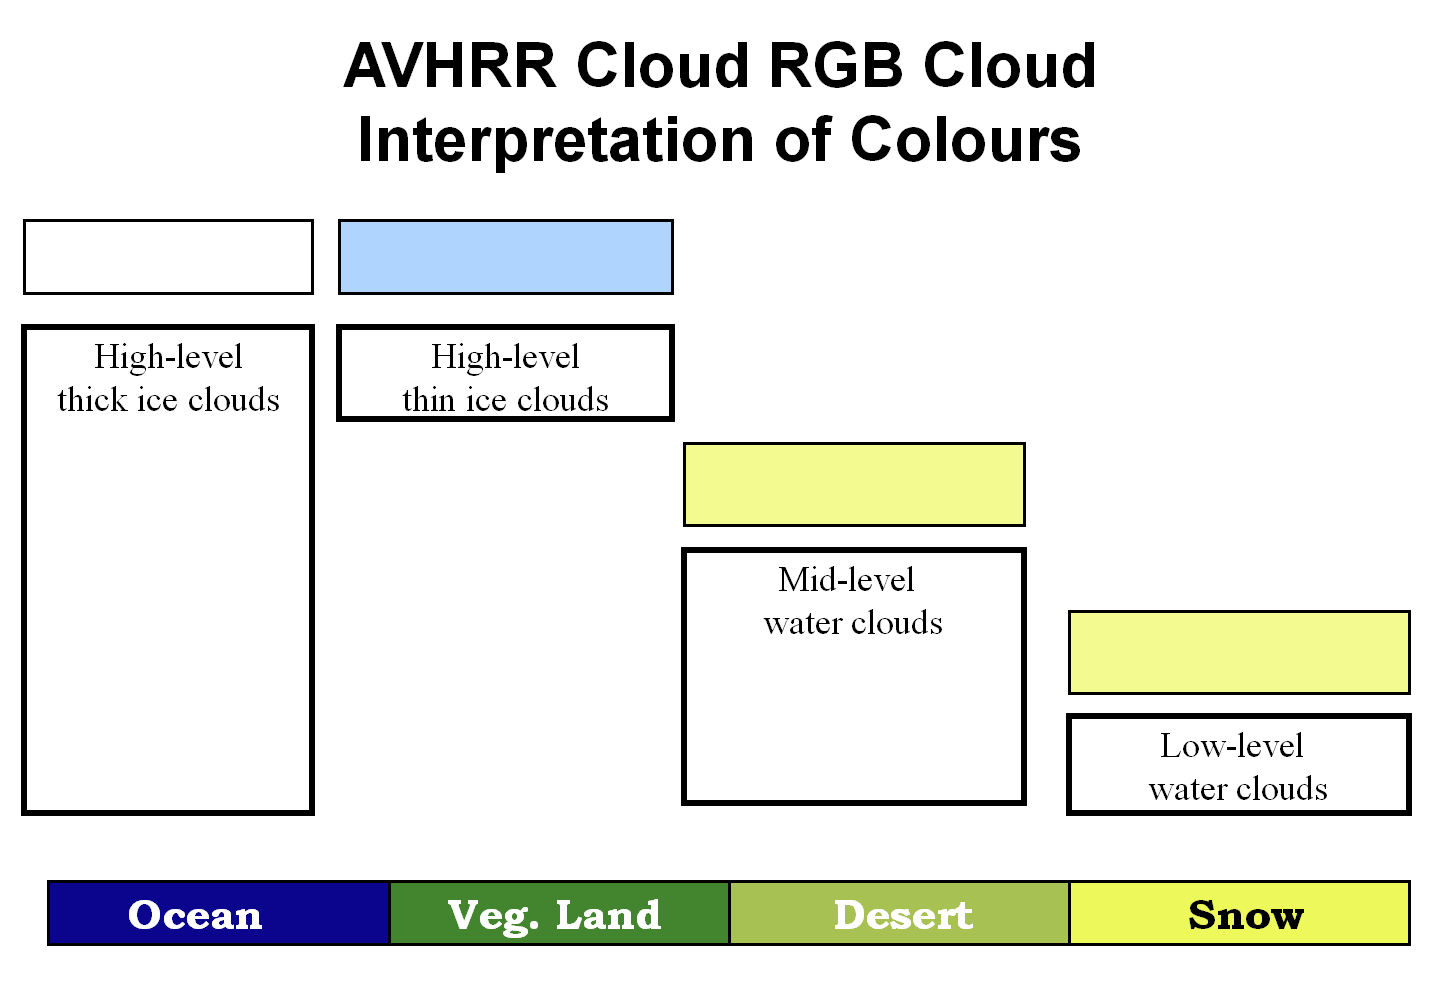
Figure 4: Typical colors of Cloud RGB images
Open water surfaces (ocean, sea, ...) are usually medium blue in AVHRR Cloud RGB images. Areas with sunglint are an exception. Sunglint is the mirror-like reflection of the sun off a water surface. Sunglint occurs on the surfaces of cloud-free oceans, seas, rivers and lakes at a given geometry between the sun and satellite viewing angles. In the sunglint area an increased amount of solar energy is reflected from the water surface. Smooth ocean water becomes a 'silvery mirror', while rougher surface waters (with big waves) appear less bright. Since oceans and seas are nearly never perfectly smooth or calm, the sun's reflection gets blurred, which gives the water a washed-out appearance. Because the reflection has similar intensity in the VIS0.63 and NIR0.87 channels and there is no reflection in the IR10.8 channel, sunglint appears yellowish in Cloud RGB images. Fig. 5 shows sunglint over the Mediterranean during two overpasses. Note that in Metop AVHRR images (morning orbit) the sunglint area typically lies on the eastern side of the satellite ground track.
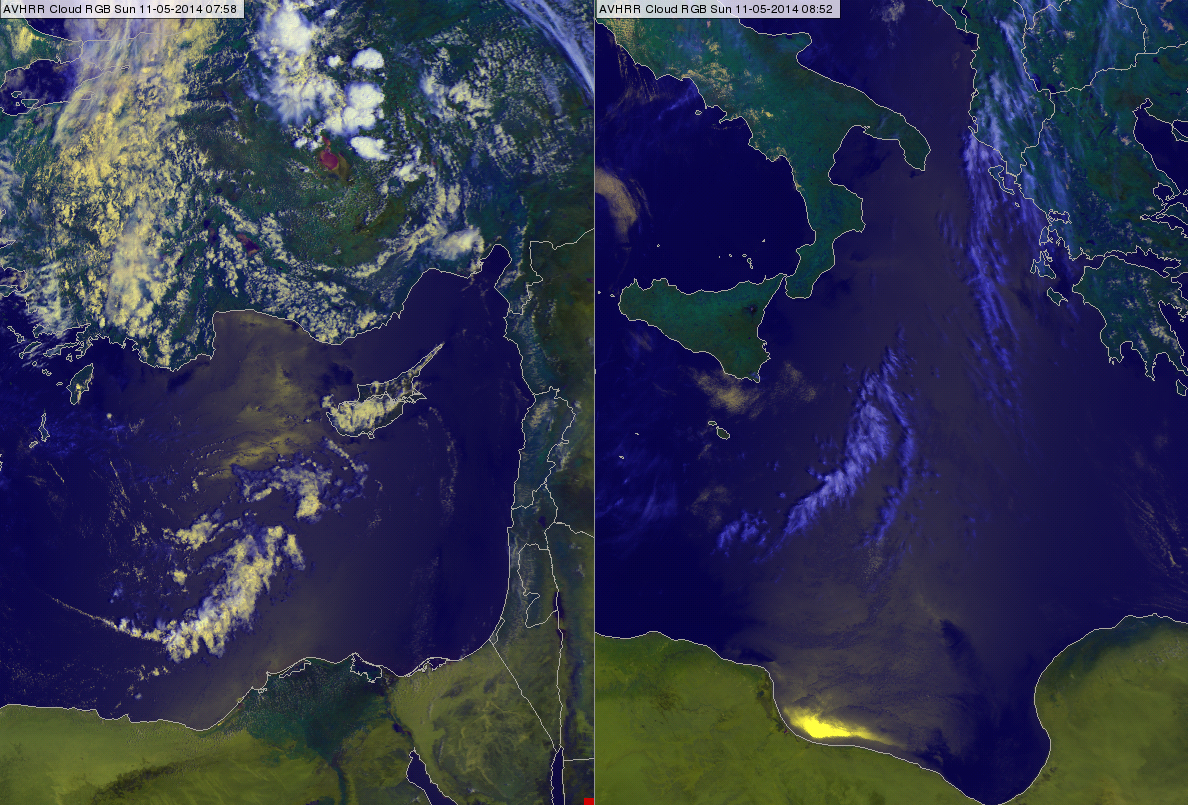
Figure 5: Sunglint over the Mediterranean Sea in AVHRR Cloud RGB images on 11 May 2014 at 07:58 (left) and 08:52 UTC (right)
Examples of Interpretation
Two cases are shown with annotations to demonstrate the proper interpretation of different surface and cloud types (Figs. 6 and 7).

Figure 6: METOP-B AVHRR Cloud RGB image on 6 April 2016 at 08:52 UTC
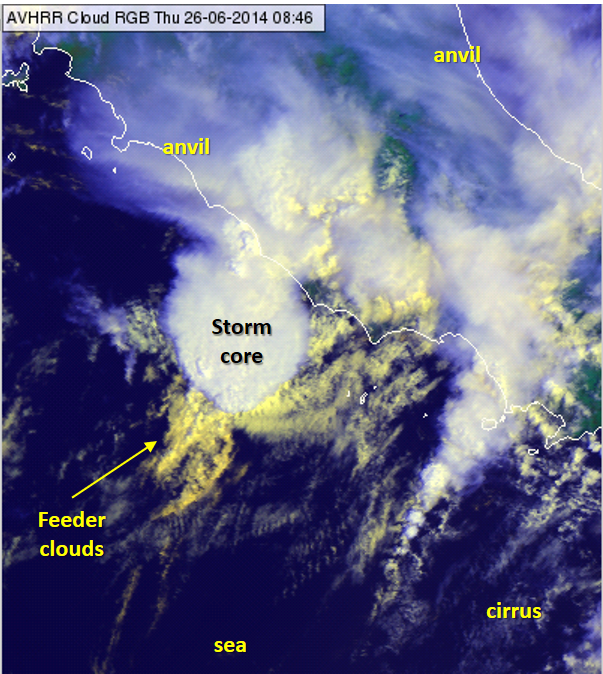
Figure 7: AVHRR Cloud RGB image off the coast of Italy on 26 June 2014 at 08:46 UTC
Benefits and limitations
Benefits:
- This RGB type is useful during the convection period. The cores and anvils of convective clouds are easy to see.
- AVHRR Cloud RGBs visualize the cloudiness of developed fronts in an informative way.
- The color of snow-free land reflects the green vegetation fraction ('chlorophyll content'): the more green vegetation there is, the greener the pixel.
- Because the colors used are (relatively) close to the natural colors of the depicted features, this RGB type is easy to understand and convenient for the public.
Limitations:
- Low- and medium-level clouds and snow have similar colors.
- The color contrast between green vegetation and bare soil is not very high. Information on vegetation also depends on temperature.
Comparison of AVHRR Cloud and SEVIRI HRV Cloud RGBs
The AVHRR Cloud RGB is compared to the SEVIRI HRV Cloud RGB, which is the most spectrally similar product among the standard SEVIRI RGBs. Note that it would be possible to create an RGB even more spectrally similar to the AVHRR Cloud RGB by using SEVIRI channels VIS0.6, VIS0.8 and IR10.8, but that is not a 'standard RGB' recommended by EUMETSAT.
In the standard SEVIRI HRV Clouds RGB the HRV (High Resolution Visible) channel is used to benefit from its higher resolution. (HRV is a broadband channel covering the 0.4 -1.1 micrometer region.)
The recipes of AVHRR Cloud and SEVIRI HRV Cloud RGBs are summarized in Table 2. The channels for the red and green components are different. The ranges - where the images should be linearly stretched - are the same.
| AVHRR Cloud RGB | ||||
|---|---|---|---|---|
| Color beam | Channel | Range | ||
| Red | VIS0.63 | 0 | 100 | % |
| Green | NIR0.87 | 0 | 100 | % |
| Blue | IR10.8 inverted | 323 | 203 | K |
| SEVIRI HRV Cloud RGB | ||||
|---|---|---|---|---|
| Color beam | Channel | Range | ||
| Red | HRV | 0 | 100 | % |
| Green | HRV | 0 | 100 | % |
| Blue | IR10.8 inverted | 323 | 203 | K |
Table 2: Recipes of the AVHRR Cloud RGB and SEVIRI HRV Cloud RGB schemes
Figs. 8a, 8b and 9 show 2-panel images of AVHRR Cloud and the best-matching SEVIRI HRV Cloud RGB images. Their spatial resolution is comparable.
Clouds have a similar appearance in both RGBs. Both RGB types contain information on cloud optical thickness and cloud top temperature: thick, cold high-level clouds are white; thin high-level cirrus clouds are bluish; while medium- and low-level clouds are yellow.
Snow appears yellowish in both RGB types. However, the AVHRR Cloud RGB may contain some information on the snow's state. If the snow is melting, it has some red tones (see the Alps in Fig. 9).
The colors of snow-free land are different in AVHRR Cloud RGBs and SEVIRI HRV Cloud RGBs.
- In the AVHRR Cloud RGB the color of snow-free land reflects the green vegetation fraction ('chlorophyll content').
- The SEVIRI HRV Clouds RGB conveys no vegetation information.
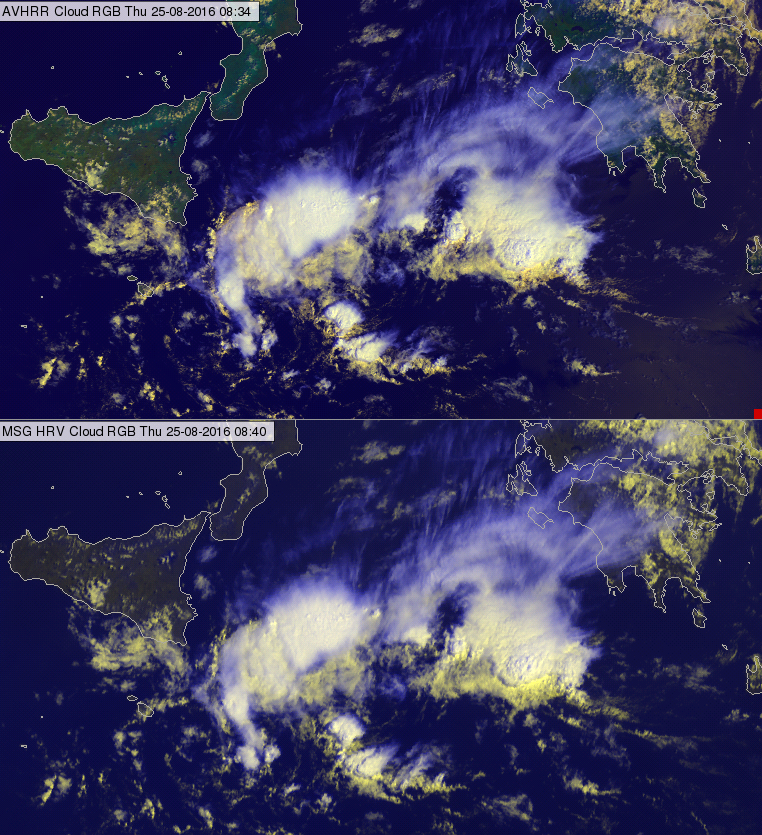
Figure 8a: AVHRR Cloud RGB (up) and SEVIRI HRV Cloud RGB (bottom) on 25 August 2016 at 08:34 and 08:40 UTC
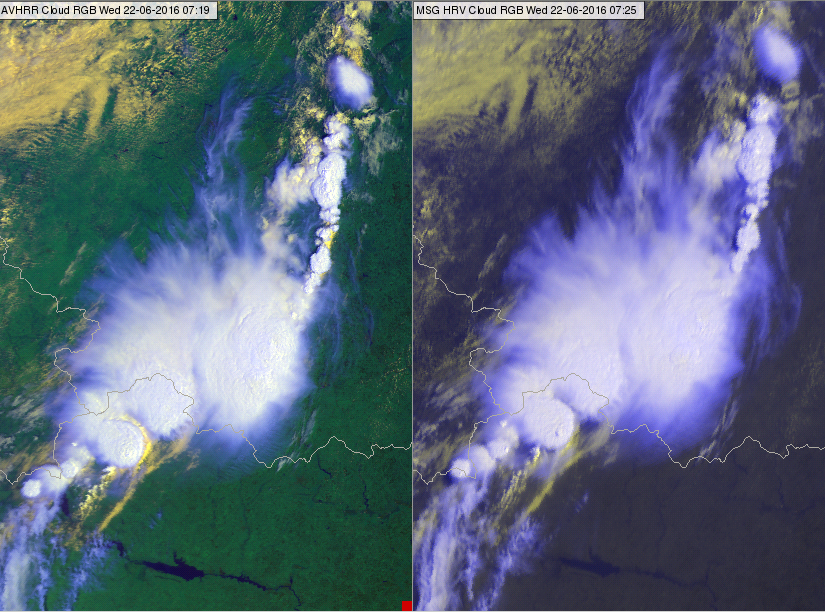
Figure 8b: AVHRR Cloud RGB (left) and SEVIRI HRV Cloud RGB (right) observed over Russia (northeast of Belarus) on 22 June 2016 at 07:19 and 07:25 UTC
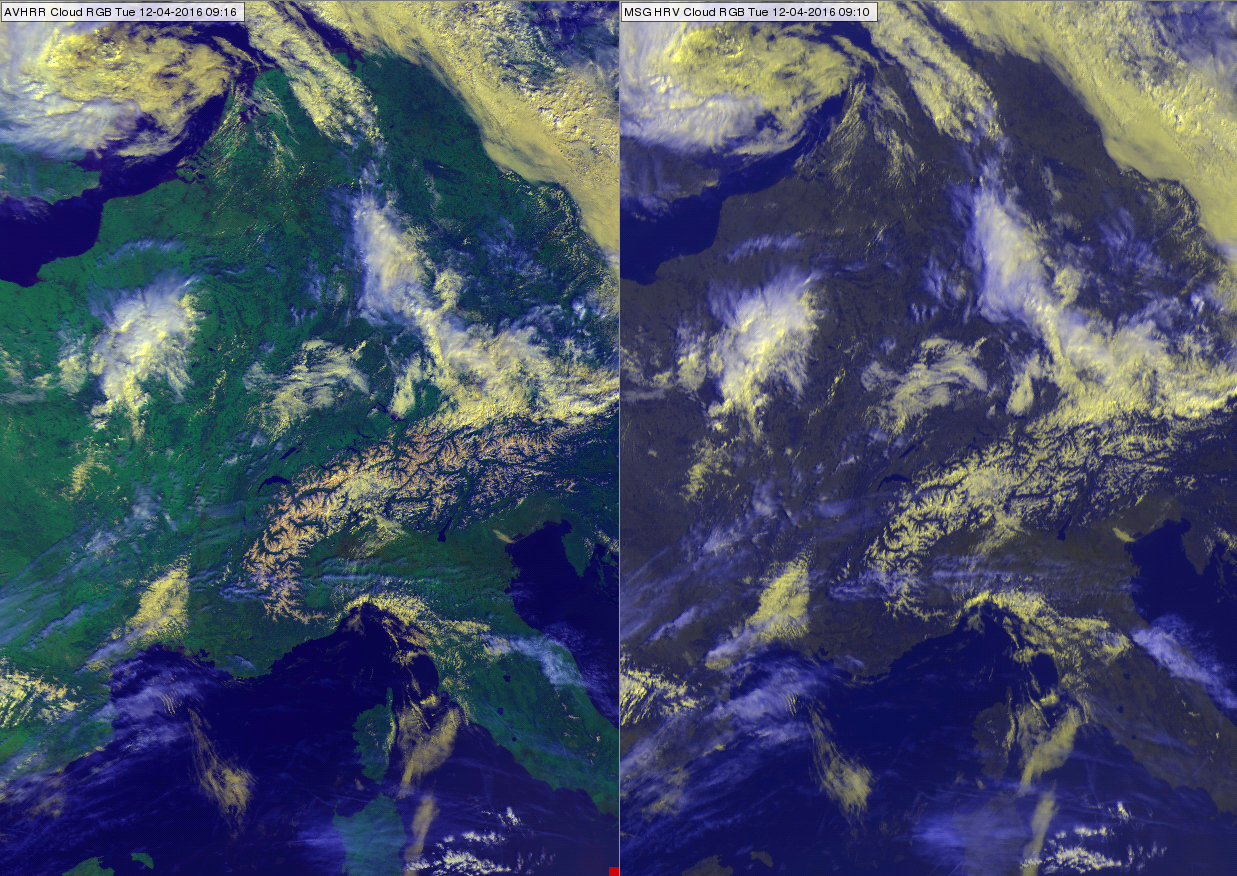
Figure 9: METOP-A AVHRR Cloud RGB (left) and SEVIRI HRV Cloud RGB (right) images on 12 April 2016 at 09:16 and 09:10 UTC
Exercise
Exercise 1
Which of the following features are present in the numbered areas in Fig. 10? Match each number with only one feature.
| 1 | 2 | 3 | 4 | 5 | 6 | 7 | 8 | 9 | 10 | 11 | |
| Medium- or low-level cloud | + | ||||||||||
| Thick high-level cloud | + | ||||||||||
| Cirrus over lower level clouds | + | + | |||||||||
| Cirrus over land | + | + | |||||||||
| Snow | + | + | |||||||||
| Sea | + | ||||||||||
| Ice on sea | + | ||||||||||
| Vegetation | + |
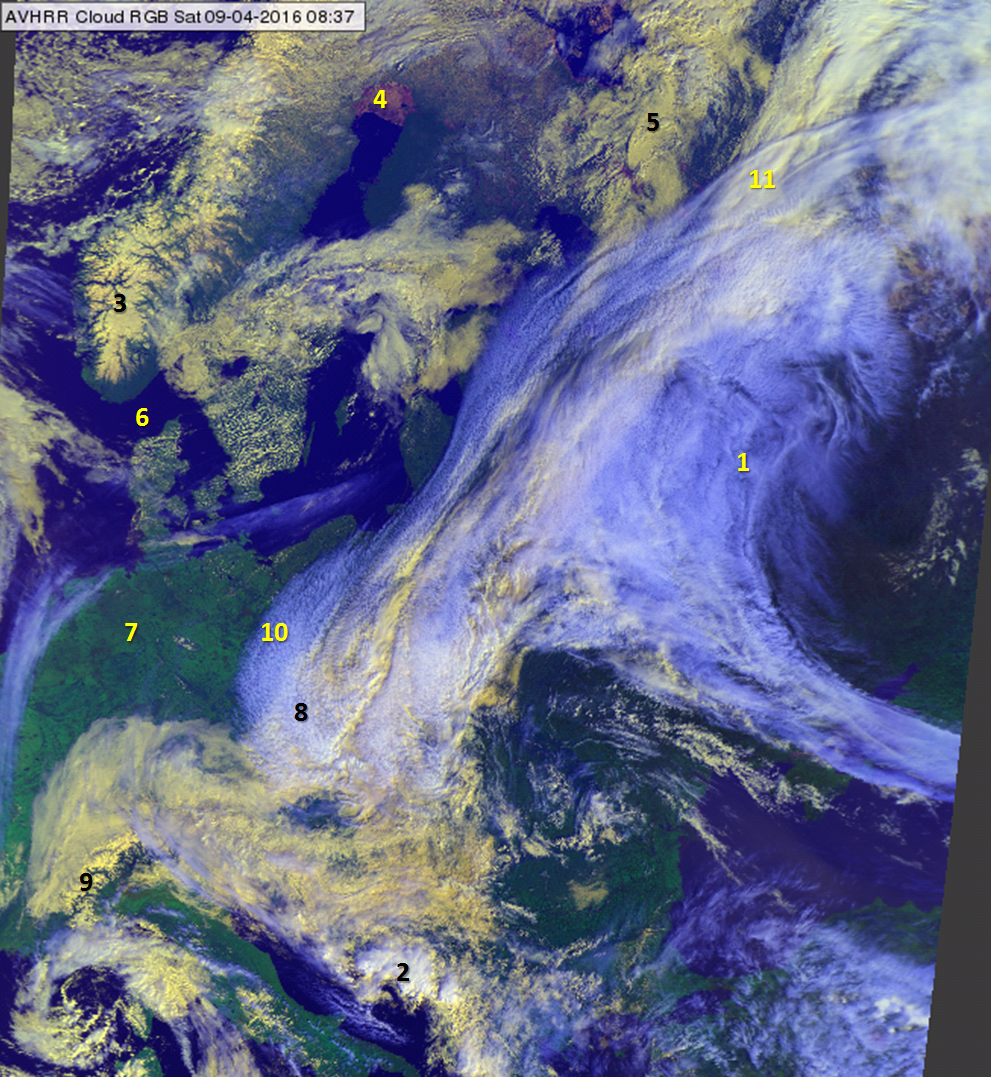
Figure 10: METOP-A AVHRR Natural Colour RGB images on 9 April 2016 at 08:37 UTC
Exercise 2
Which of the following features are present in the numbered areas in Fig. 11? Match each number with only one feature.
| 1 | 2 | 3 | 4 | 5 | 6 | 7 | 8 | 9 | 10 | 11 | 12 | |
| Thick high-level cloud | + | + | ||||||||||
| Medium- or low-level cloud | + | + | ||||||||||
| Cirrus | + | + | + | |||||||||
| Snow with wave clouds | + | |||||||||||
| Sea | + | + | ||||||||||
| Vegetation | + | + |
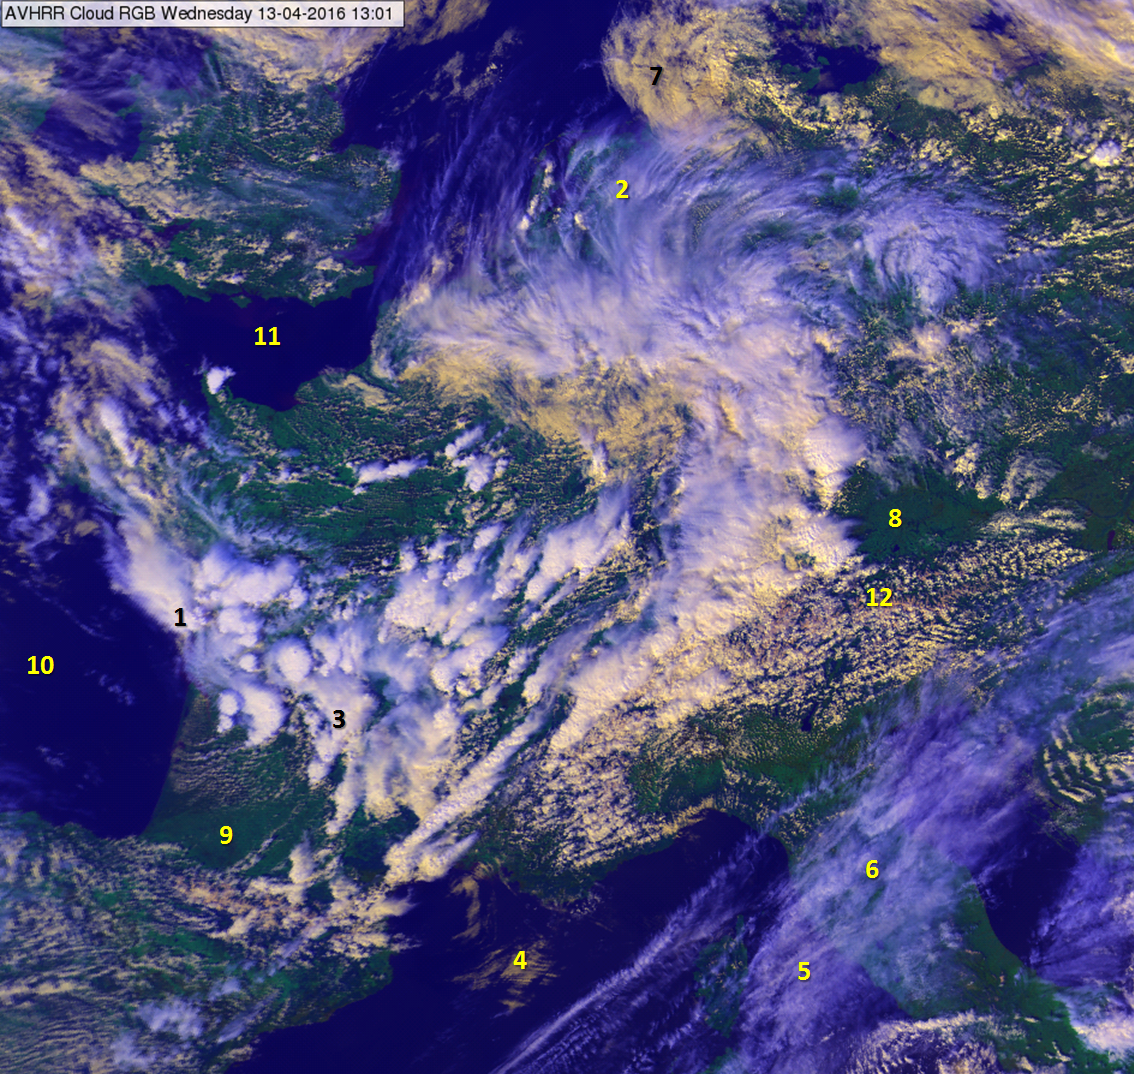
Figure 11: NOAA-19 AVHRR Cloud RGB image on 13 April 2016 at 13:01 UTC